Develop Plans
Approaches to Developing Watershed Plans Using CAST
This framework is offered as one approach for developing a nitrogen, phosphorus and sediment reduction plan for any geographic area within the Chesapeake Bay region. This framework is directed toward developing plans for the Chesapeake Bay TMDL, but is applicable to the development of other water quality improvement plans. The primary audience is local government planners who will use CAST to estimate the nitrogen, phosphorus and sediment loads resulting from selecting one or more BMPs to achieve their goals. More information on using CAST to develop plans is under How To>User Documentation. Then click on Getting Started in the table of contents.
The following topics are discussed below:
- Steps to Developing a Plan
- Identifying Goals
- Translating Goals to BMPs
- Considerations for Developing Plans
Steps to Developing a Plan
The following diagram summarizes a sequence of steps for developing a water quality improvement plan.
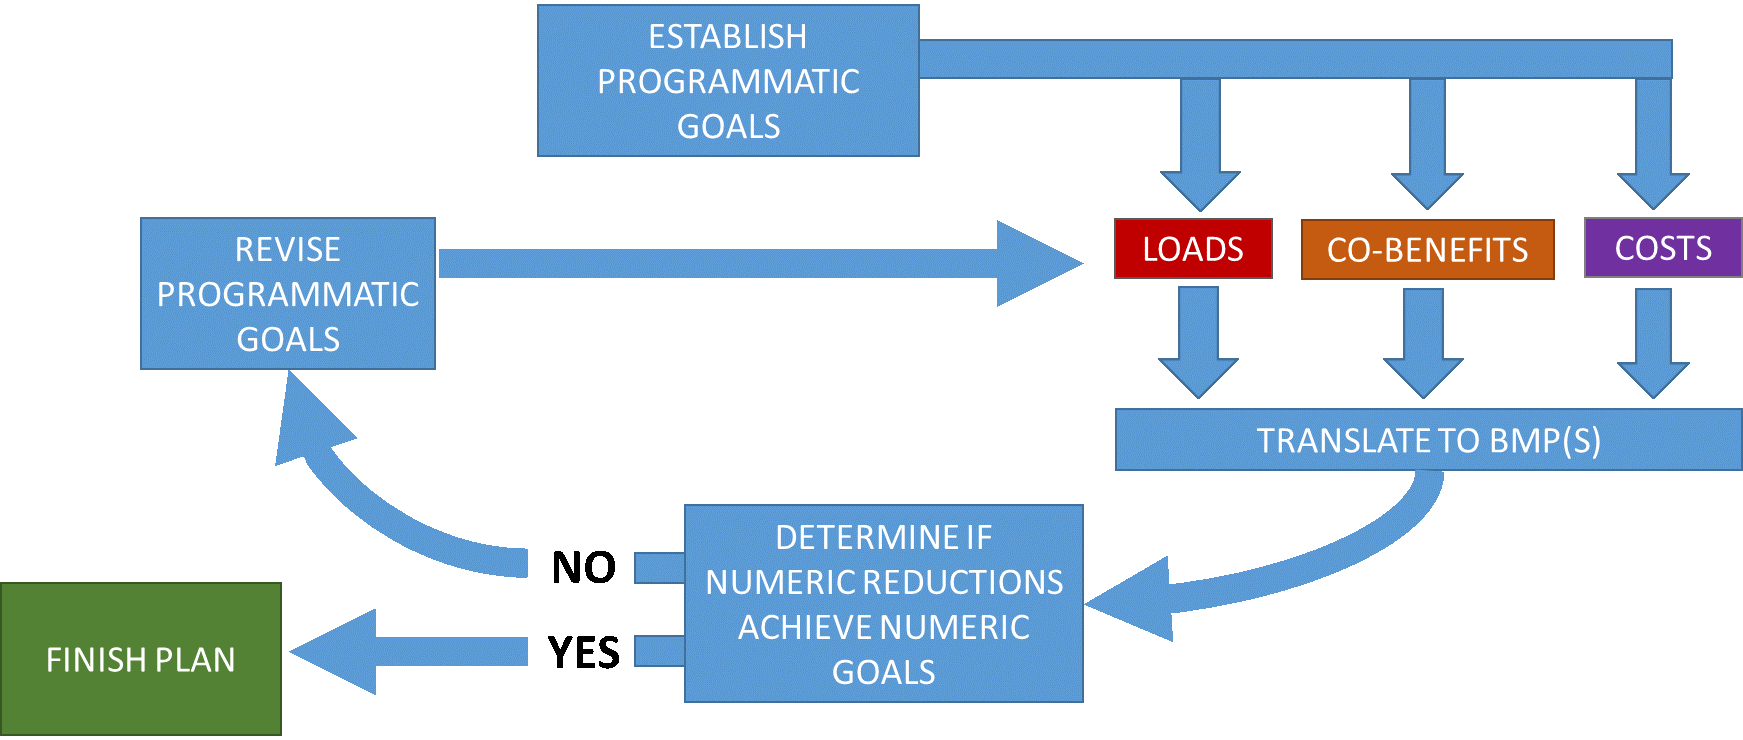
- The first step is to establish programmatic goals that include quantifiable loads for nitrogen, phosphorus and sediment; co-benefits from implementing BMPs, and the costs of implementation.
- The second step is to translate a combination of programmatic goals into specific BMPs, and then use those BMPs in a CAST scenario to estimate nitrogen, phosphorus and sediment loads.
- The third step is to determine if the loads are achieving the programmatic goals. If not, it is necessary to revise programmatic goals, perhaps changing co-benefits and/or costs, and then revising the scenario to estimate loads again.
- Once the estimated loads meet programmatic goals, the final step is to finish the plan and send it to the next level of the planning process.
If you are developing a scenario for a township or community where the geography is not in CAST, simply create a plan for a county or any geography that is close and multiply the resulting loading rates (i.e., pounds per acres) by your land use area. There are 3 ways to access loading rates using CAST: 1) use the scenario loading rates available from a Loads Per Unit report; 2) use the scenario loading rates as displayed on Compare Scenarios; and, 3) download the results in a Loads Report, then calculate your own loading rates as pounds per acre in a spreadsheet. A How-To Guide and an example spreadsheet are available to demonstrate how this is done. If you are working at a scale of a Maryland 8-digit watershed, use these images and spreadsheet to map to a CAST modeling segment.
Identifying Goals
Planning Goals for the Chesapeake Bay TMDL Phase III WIP
Local area planning goals (LAPG) are developed from the draft Phase III WIP Planning Targets for developing the Watershed Implementation Plan (WIP). View more information and download the LAPGs at the link below. Compare progress toward the Phase III WIP Planning Targets at the link below. The WIPs are posted to EPA's website.
Planning Goals Compare Planning Targets
Non-Numeric Goals
Reducing nitrogen, phosphorus and sediment while increasing the return on investment requires identifying programmatic goals. Programmatic goals can be identified and then modeled to determine a load reduction. This quantifiable information informs the refinement of the programmatic goals. Many goals may be non-numeric but may imply numeric outcomes. Some programmatic goals can be translated to BMPs.
Examples of non-numeric goals may be a growth policy that includes a regulation on large lot development or zoning requirements. Changes in development strategies are another example of programmatic goals that may be translated to a quantifiable load reduction. Changes in development strategies result in a change to land use. An example is establishing a policy on large lot development that requires a certain percentage to have tree cover. Increased trees or forest land can be modeled with Tree Planting or Buffer BMPs. Land conversion from developed to agriculture can be modeled by Impervious Surface Reduction. Land conversation from impervious developed to pervious developed can be modeled as Tree Planting – Canopy.
Another example is an agricultural regulation on using a Phosphorus Site Index to determine the amount of fertilizer applied. This regulation translates into the BMP Nutrient Management Phosphorus Application Rate Reduction which has a quantifiable effect on phosphorus loads. The programmatic goal in this example is establishing the Phosphorus Site Index as a requirement and the numeric goal is the acres of the Nutrient Management BMP and associated phosphorus load reduction.
Numeric Goals for Nitrogen, Phosphorus and Sediment
There may be programs, policies, or regulations that encourage or require nitrogen, phosphorus and sediment reduction. Planners should be provided with goals, or targets, in one of three forms: percent reduction, pounds of load, pounds reduced. A plan developed in CAST can show the loads in any of these three forms.
Percent Reduction is available from the Results, Compare page on the third tab. This requires the user to identify an initial condition and compare that condition to one or more plans. CAST shows the percent reduction from the initial condition.
Total Pounds delivered to the edge of a stream (EOS) or to the tidal waters of the Chesapeake Bay (EOT) on an annual basis is available from the Results, Compare page on the second tab. The total pounds per load source per year is shown for the scenarios selected by the user. An initial condition should be identified and selected along with one or more plans.
Pounds Reduced also is available from the Results, Compare page on the second tab. Just as with total pounds, the user selects the initial condition along with one or more plans. Then the user can simply subtract the difference in load for nitrogen, phosphorus and sediment.
Numeric goals may be provided at any geographic scale. For example, they could be at the scale of county, state-river basin, or watershed of any size. Plans can be developed in CAST at any of these geographic scales for any area or combination of areas in the Chesapeake Bay Watershed. Results may be viewed and downloaded at any geographic scale as well. Whenever a user creates a scenario or views results, the user is asked to select the geographic scale and area.
The goals may be specified for a particular source sector. Examples of non-point source sectors are developed, agriculture, and natural. The developed sector includes pervious and impervious land in urban areas and rural areas. There is no distinction between new development and redevelopment. The agricultural sector includes pasture, cropped land, animal feeding space and riparian pasture manure deposition. The natural sector includes streams, Chesapeake Bay shoreline, forests and wetlands. CAST input and output is separated into these source sectors. Users add BMPs separately for each source sector and may view results by source sector and for all sectors summed together.
BMP Targeting maps have been created using CAST delivery factors and 2022 Progress loads to communicate which land-river segments in the watershed would be most effective for BMP targeting. Delivery factors represent the fate and transport of nutrients and sediment from the land to the water, So, the higher the delivery factor, the higher the amount of nutrients and sediment are likely to run off from that area. There are six bivariate targeting maps, one for each nutrient and sector. The legend on each map has a box with 9 colors, representing the variation of loads and delivery factors in each land-river segment, from low to high. The lightest, bottom square in the legend correlates to the land-river segments on the map that have the lowest loads, and the lowest delivery factors. The square at the top of the legend, which has the darkest coloring, shows the areas that have the highest loads, and the highest delivery factors. These are the areas that would be most effective for BMP targeting. The Explaining Changes in Nitrogen and Phosphorus Loads Using Land Management Practice Data and How These Data Can Indicate Where Practices Could be Targeted in the Future presentation explains how these data can be used.
Reducing Costs and Maximizing Co-Benefits
In addition to nitrogen, phosphorus and sediment goals, there may be additional, complementary objectives. Examples of additional objectives include:
- Reducing implementation costs
- Prioritizing co-benefits.
Cost Effectiveness of BMPs
Knowing the BMPs that are most effective and have the lowest cost makes it possible to develop an effective plan. We list in a spreadsheet the typical pounds of nitrogen, phosphorus, and sediment reduced for every BMP. These data are presented in terms of an acre of BMP, or the appropriate unit for the BMP like animal units, feet or acres treated. We also provide the cost of each BMP, and the cost per pound reduced. These data differ by geographical area since there are variable landscape characteristics. To determine the most cost effective BMP, simply filter the table for your geographic area, then sort the table on the cost per pounds reduced for the targeted pollutant. We provide the data at the state and county scales.
More resources for estimating costs and the load reduced per BMP may be downloaded from CAST under the Public Reports > Cost Profiles.
A range of agencies and organizations support the Chesapeake Bay Program's work. While an estimate of the total funding directed toward the Chesapeake Bay Watershed Agreement is not available, the information on the Chesapeake Progress Funding page outlines the state and federal funding reported through the Office of Management and Budget as part of the Chesapeake Bay Accountability and Recovery Act.
BMP Co-Benefits
Examples of co-benefits include: improve stream health, increase fish habitat, and reduce toxic contaminants. Identifying these additional objectives early in the planning process allows for selection of BMPs that meet the load reduction goals as well as achieve these complementary objectives. More information about the co-benefits of BMPs can be found on the Ecosystem Benefits page.
Translating Goals to BMPs
Create a Scenario
The starting place for developing a plan for reducing nitrogen, phosphorus, and sediment is to create a new scenario. In CAST, you will be asked to select a geographic scale and area, e.g.: state, county, small watershed, etc. You will be asked to select the initial conditions and wastewater scenario. Wastewater is handled through permits so may not be edited. However, multiple wastewater scenarios are available to facilitate your planning if that is a load that you are considering.
Next, determine the appropriate scenario from which to copy BMPs. The BMPs copied in are your building block. From there, you will add BMPs to meet your planning goal. There are several options from which to select for copying in BMPs. You may choose the latest annual progress scenario. The annual progress scenario includes all the BMPs that are implemented and functioning in that year, regardless of the year in which they were constructed or performed. For example, a 2019 Progress scenario includes cover crops planted in 2019, street sweeping performed in 2019, and forest buffers implemented in any year that are still present and functioning. Selecting a progress as the initial building block allows maximum flexibility. The planner may then remove BMPs that are expected to lose functionality (i.e.: not maintained) and add any BMPs to meet the goals.
Another option is to begin with the last WIP that was developed. The last WIP was the Phase III WIP developed on the 2025 initial conditions. Using the previous WIP will get you closer to the goal than the progress. However, the BMPs selected for the previous WIP may no longer be the most appropriate choice. Goals, planning priorities, and the public will to implement certain BMPs may have changed. Better information about the effectiveness of BMPs may have been gained since the last WIP, resulting in a different level of effectiveness for some BMPs. New BMPs and technological innovation may have occurred allowing for better options than were in the previous WIP. Also, the goals may be allocated to sectors or geographic areas differently. If you have other goals, like co-benefits or reducing costs, these may not have been considered in the same way for the previous WIP.
The Phase III WIP is developed on 2025 conditions. This means that the number of animals, septics, and amount of each load source (cropland, pasture, developed, etc.) will be different. So not all the BMPs in the WIP may be credited if the BMPs are at the limit of the land, animals, or septics are available. These changes may make it necessary to change some of the BMP selections in the previous WIP.
Beginning with no BMPs is an option, but is not recommended. It is expected that planners have been reporting BMPs to the states, that in turn report to the Chesapeake Bay Program, so that the annual progress scenario represents the current condition.
Once the initial BMPs are copied into a scenario and your scenario is created, then you may edit the BMPs to reflect current and planned policies. You may edit the BMPs in the scenario to increase implementation levels, or you may add new BMPs.
Methods for Adding BMPs to a Scenario
There are three ways you can add BMPs:
- Copy from an existing scenario
- Upload from a file
- Add one by one from the input box on the screen for each sector
Whichever way or combination of ways you choose, you can add BMPs for any geographic scale. CAST allows BMPs to be uploaded from a file. Uploaded BMPs are tab-delimited text files. The downloadable tables below show the list of required columns and sample data for the files. More information is available in the document, Uploading BMPs to CAST.
Considerations for Developing Plans
When selecting BMPs, consider the ability to actually implement these BMPs. Is there the public will? Is there funding? Are the practices voluntary or mandated? A plan should be realistic and have the support of the land owner or responsible party. As such, it is critical that these land holders or responsible parties are included in the plan development process.
To get the largest reduction for the least amount of implementation, consider several factors. First, determine the highest loading load sources and geographical areas. This is where the BMPs can have the most effect. The load sources with the highest initial load is where the greatest opportunity exists for reductions. Likewise, those geographic areas with high loads also have high opportunity for reductions. This may be in a county with lots of agricultural animals, or it may be in an urban area with a particularly high load for various reasons related to how it was developed and the geographic characteristics.
Remember to bring in the information on non-numeric goals, like policies or regulations that can have an impact. Also, consider the costs and co-benefits that are important to the community. The BMPs selected should be efficient, maximize return on investment, and improve quality of life.
Local government engagement is critical to implementation success. Recommendations for educating local government officials are in Strategic Outreach Education Program for Local Elected Officials.
The Local Leadership Workgroup developed a Local Guide to the Chesapeake Bay, a seven module series created to support decision-making by local officials. You can find these modules on the Local Leadership Workgroup homepage, including guides on How Your Watershed Works and Foundations of Clean Water.
Financing BMP Implementation for Urban Stormwater
There are many financing resources available. One resource is the EPA Water Finance Clearinghouse, which is a web-based portal to help users locate the information and resources that will assist decisions for drinking water, wastewater, and stormwater infrastructure needs. The Water Finance Clearinghouse includes two searchable databases: one contains available funding sources for water infrastructure and the second contains resources (reports, links, webinars, etc.) on financing mechanisms and approaches that can help communities access capital to meet their infrastructure needs. Training modules may be utilized that focus in various water sectors.
The Water Finance Clearinghouse was developed by EPA's Water Infrastructure Finance and Resiliency Center, an information and assistance center identifying water infrastructure financing approaches that help communities reach their public health and environmental goals. The Water Finance Clearinghouse is updated on a rolling basis. States, federal agencies, and other water sector stakeholders can edit or submit new resources or funding options to the Center at any time.
A presentation and transcript on using the Water Finance Clearinghouse can help you get started with using their tool.
The Environmental Finance Center (EFC) at the University of Maryland assists communities in addressing the how-to-pay issues associated with resource protection. The EFC prepared the Local Government Stormwater Financing Manual: A Process for Program Reform to provide local government leaders the tools to establish and grow effective stormwater management programs that maximize the value and impact of every dollar invested in their communities. Examples of projects the EFC has supported can be found on the Stormwater Financing and Outreach page on their website. Examples of documents prepared by the EFC for local governments are listed below.
Calvert County, Maryland Water Quality Financing Strategy
Lancaster County Municipal Stormwater Management Financing Feasibility Study
NRCS Practice Names and Codes
A crosswalk of NRCS practice names and codes to the CAST BMP name may be helpful in selecting the CAST BMP that best represents your management action.