Using This Site
Below are some basic tips on how to navigate and use the CAST site.
Ribbon
The user can access any of the CAST pages using the Ribbon at the top of each page. Many of the links represent groupings of features. Placing your mouse over the word opens a dropdown with additional items.
Before logging in, the Ribbon provides limited functionalities including access to a set of public reports available under the link with the same name.
User Profile
The Manage Profile link is the only page not accessible from the Menu Bar. It is located on the right side of the banner above the Menu Bar.
Help Icons
Help icons are distributed throughout the application and provide a short description of CAST features. Placing your mouse over the question mark icon will display the message.
View Documentation
The View Documentation button links to the section of the User Documentation pertaining to page being displayed.
Tool Tips
Tool Tips are provided throughout the application to provide information about icon functionalities, items contained within the different grids or BMP entries.
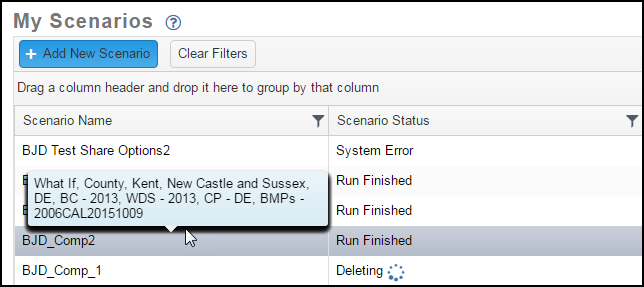
The Scenario Name tool tip in the My Scenarios grid displays the scenario description the user created. It is an effective tool to display the selections used to create a scenario where the Add, Edit, Run and Delete functionalities are available instead of having to edit the scenario to view these details.
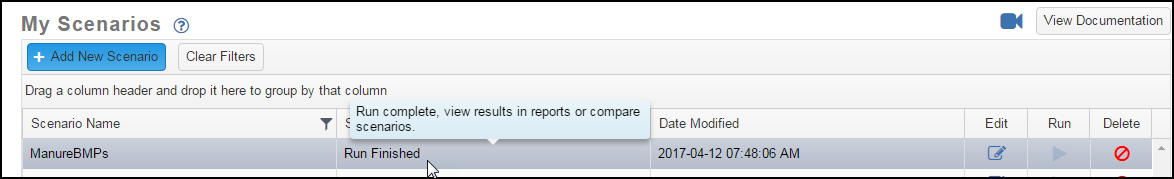
The Scenario Status tool tip in the My Scenarios grid provides information on where your scenario is in the processing cycle and what options may be available to the user, such as viewing the results on the Reports page or using the scenario for comparison.
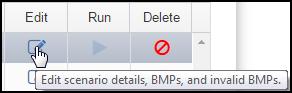
The Edit icon tool tip in the My Scenarios grid reminds users that the BMP tabs, including invalid BMPs, are located under the edit functionality.
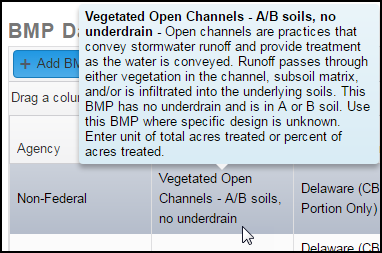
On the BMP tabs, tool tips provide definitions for BMPs, Agency and Load Source column items in the BMP Data Submitted grid. The example below displays the BMP definition.
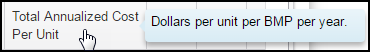
A useful tool tip is provided for the Total Annualized Cost Per Unit column in the BMP Data Submitted grid for the Developed, Septic, Natural and Agriculture tabs defining the units associated with it.
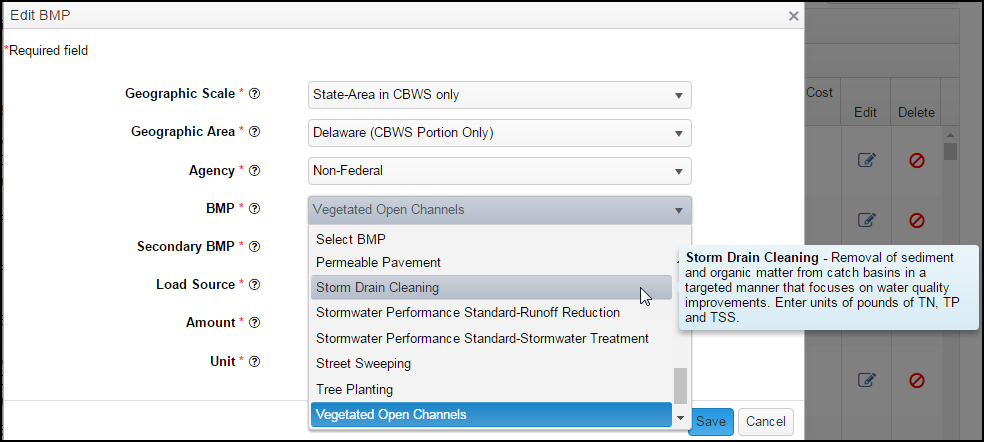
Valuable tool tips are also provided on the Add and Edit BMP pop ups providing useful information on items in the dropdowns for Agency, BMP, Secondary BMP and Load Source required parameters.
Video Icons
Videos are available for some CAST functionalities and are indicated with the video icon. A complete list of all videos is available under the Tutorial Videos link in the How To dropdown. Clicking the video icon opens a video player to display the selected recording.
Contact Us
The user can contact the CAST Admin Team using the Contact Us link on the menu bar. After the Contact Us pop up opens, enter a subject and message and click the Send button. A confirmation message will appear, clicking the OK button will complete the process.
Getting Started
Click Here for the How-To Guide to Answer Common Questions
The first step in evaluating nitrogen, phosphorus and sediment loads is to determine your target, or reduction goal. The target may be in pounds of nitrogen, phosphorus and sediment, or it may be a percent reduction. Either way, you will want to create more than one scenario and/or cost profile to make comparisons of the impact and cost of different BMPs. A baseline scenario can be quickly created using the option to either copy the BMPs from an existing scenario or to import the BMPs from files during the selection process. The creation of a baseline scenario and then making copies of it with different cost profiles or with post-creation edits to isolate the impact of specific BMPs is recommended.
When using CAST for local TMDL plans, the local TMDL allocation may not have been developed with CAST and would not be comparable to load estimate methodology and assumptions in CAST. In these cases, the recommended approach is to calculate the percent change between the initial condition and the allocation in the TMDL. Then verify that the baseline and plan you developed in CAST meet that percent change. It is made easy because the percent change is shown in Compare Scenarios under Results.
If you are developing a scenario for a township or community where the geography is not in CAST, simply create a plan for a county or any geography that is close and multiply the resulting loading rates (i.e., pounds per acres) by your land use area. There are 3 ways to access loading rates using CAST: 1) use the scenario loading rates available from a Loads Per Unit report; 2) use the scenario loading rates as displayed on Compare Scenarios; and, 3) download the results in a Loads Report, then calculate your own loading rates as pounds per acre in a spreadsheet. A How-To Guide and an example spreadsheet are available to demonstrate how this is done. If you are working at a scale of a Maryland 8-digit watershed, use these images and spreadsheet to map to a CAST modeling segment. If you are creating a plan for a farm-scale project, you may use the Farm Scale Pollutant Load Analysis How-To Guide. Questions 1 and 2 in the guide will step you through how to calculate the loads for your farm.
A baseline scenario may be for a certain year with that year's BMPs. Alternatively a baseline may be for a condition where there are no BMPs considered, also known as a no-action scenario. For Bay TMDL WIPs, 2009 is usually used as a baseline. For Bay TMDL milestones, the current conditions typically are used as a baseline. For example, a 2021 Milestone may be created in 2019. A baseline is 2019 and saved. Then a scenario is created copying those 2019 BMPs and additional BMPs and levels of implementation are added to a new scenario on 2021 base conditions to achieve the 2021 Milestone target.
A cost profile is required to create a scenario and the user has the options of using the official state profile, a shared cost profile or one they have created. Like scenarios, cost profiles can be quickly created using the option of copying an existing profile and then making modifications to evaluate the impact of different cost values. If the user wants to create their own cost profile, this will need to be completed before the scenario creation process. Alternatively, a user may edit a scenario after creation and associate a different cost profile with that scenario. This is a useful way to determine a range of costs for the same scenario.
The user can view the results of their scenarios in various reports, graphs and comparisons which can be selected from the Results dropdown in the menu bar. Report options include: BMP Summary, BMP Submitted vs. Credited, Base Conditions, Loads, Loads Per Unit, BMP Input Files, Nutrients Applied, Wastewater, Atmospheric Deposition or Quick Results. All reports can be downloaded for viewing. More information on each report is available in the Results section of the documentation.
The compare scenarios page allows the user to review the results of up to four scenarios at once. The results are shown in: Annualized Costs and Load Source Acres, Loads, Loading Rate, and Percent Change tabs on the page which only appear after the comparison is run. The different grids on each tab can also be downloaded for use or further tabulation.
The Graph page allows the user to create graphics for up to four scenarios at once. The graphics generated include source sector charts for nitrogen, phosphorus and sediment loads for each scenario as well as two sets of bar graphs that combine results for all scenarios. Nitrogen and phosphorus loads are combined in the first graph and sediment is displayed in the second graph. Clicking on the key of the bar charts adds or removes that element.
Home Page
The CAST Home Page provides the functionality to log in to CAST, access public reports, review CAST's upgrade history, register for a CAST account and manage a forgotten password. It also provides valuable information and links to other Chesapeake Bay Program data and information associated with water quality monitoring and modeling that most CAST users will find useful. This information is available in one central location and without requiring a CAST account or logging into CAST first.
Ribbon
The Ribbon on the Home Page also allows users access to the Public Reports (Reports, Maps and Public Cost Profiles), How To (User Documentation, Tutorial Videos and Webinars), Upgrade History (under About), Model Documentation (under About) and the Contact Us links without signing into the application.
New to CAST?
Users new to CAST are prompted to register for increased functionality and to stay updated by clicking the Register button. Users are taken to the Getting Started chapter of the User Documentation by clicking the Where to Start button.
Resources
The Resources section contains links to frequently requested data and information associated with water quality monitoring and modeling. The content of this section changes to reflect current topics and user needs.
Public Reports
Reports
Under Public Reports the user can download reports and maps using public scenarios as well as public cost profiles without a CAST account or logging into CAST first.
The Reports page allows users to download reports based on publicly shared scenarios including annual progress, no action, Everything by Everyone, Everywhere (E3) and Phase 2 Watershed Implementation Plans (WIP2). Access is restricted to a limited set of report types and the state geographic scale. The reports available include:
- BMP Summary Report
- BMP Submitted vs. Credited Report
- Base Conditions Report
- Loads Report
Depending on the type of public report selected, the user will need to select the following information to generate a report.
| BMP Summary Report | BMP Submitted vs. Credited Report | Base Conditions Report | Loads Report |
|---|---|---|---|
| Report Name | Report Name | Report Name | Report Name |
| Scenario(s) | Geographic Scale | Scenario(s) | Geographic Scale |
| Scenario(s) | Scenario(s) | ||
| Aggregations(s) |
To access more selection options while generating reports, create a CAST account or log into your CAST account.
Maps
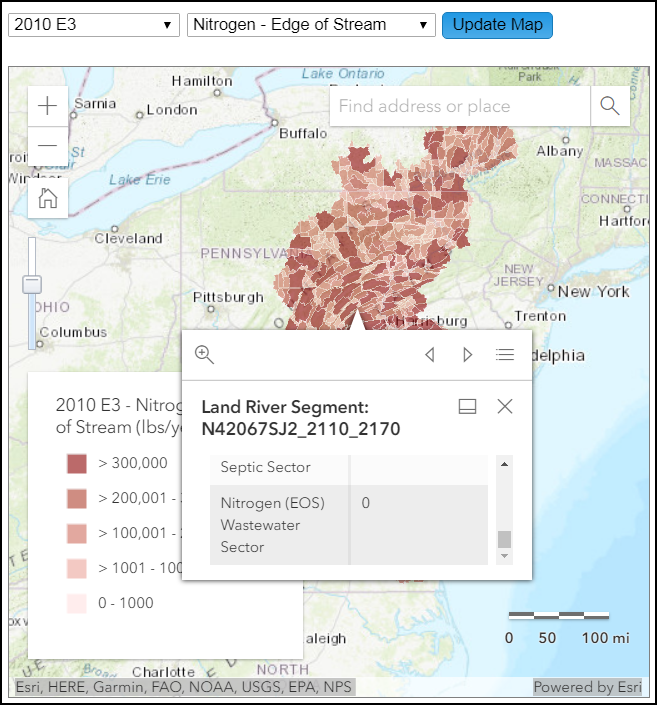
The Maps page allows users to view or compare maps based on publicly shared scenarios including annual progress, no action, Everything by Everyone, Everywhere (E3) and Phase 2 Watershed Implementation Plans (WIP2). The user can select a map based on a specific scenario, load (nitrogen, phosphorus or sediment) and scale (edge-of-stream or edge-of-tide).
Clicking a specific point within the watershed map will open an information textbox with specific data and graphs for that area.
Clicking the Zoom To link in the information textbox will automatically zoom in to that area on both maps. Even if you change the map selection in the Secondary Map section, it will open at the same zoom level.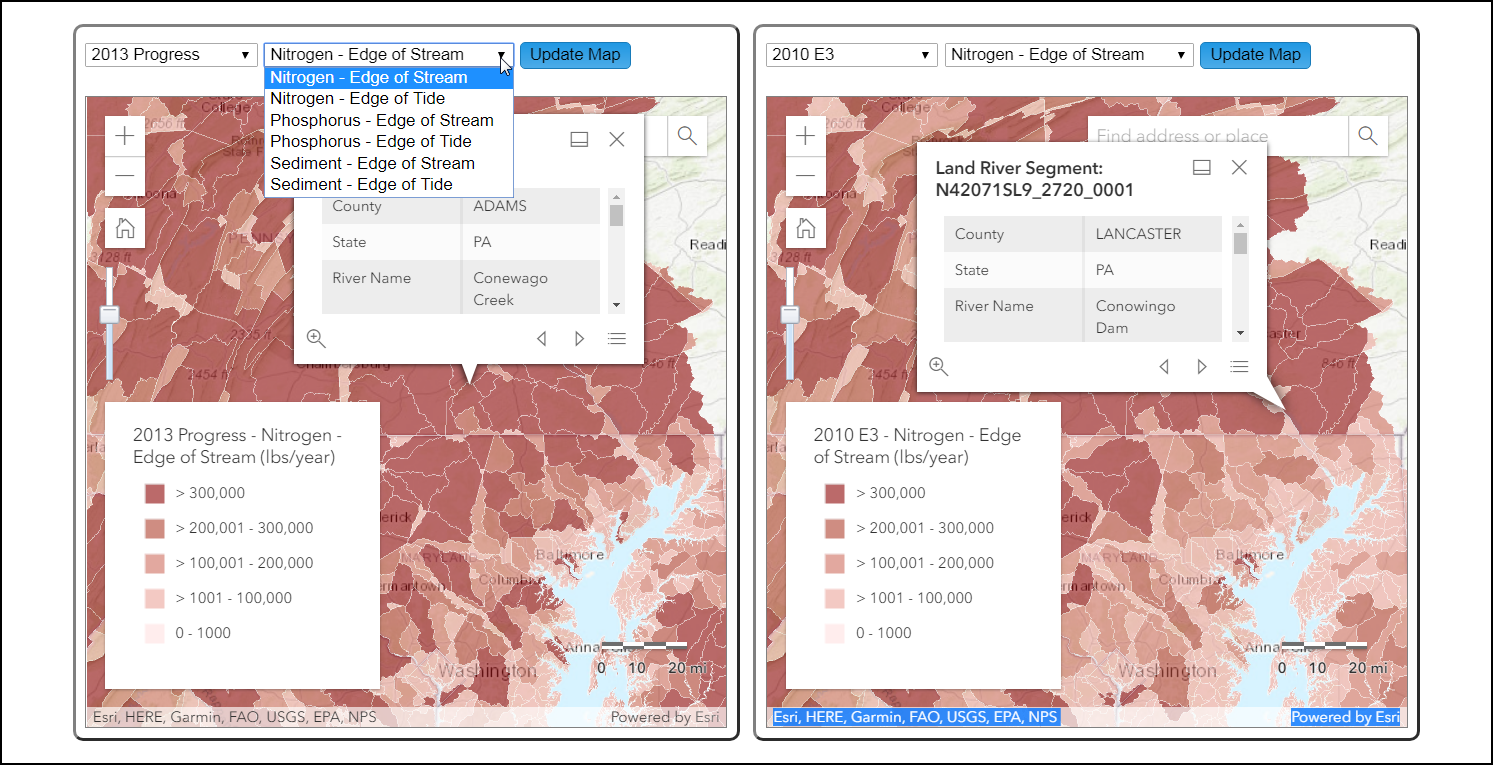
Public Cost Profiles
Default unit cost estimates are provided for each state and the Chesapeake Bay Watershed. The Chesapeake Bay Watershed is an average of all states. Costs are provided as a starting point to use for creating your own cost estimates of various BMP scenarios. Costs are estimated in 2018 dollars. Capital and opportunity costs are amortized over the BMP lifespan and added to annual operations and maintenance (O&M) costs for a total annualized cost.
Costs are annualized average costs per unit of BMP (e.g.: $/acre treated/year). The formula is:
- annual costs = (capital * annualization factor) + O&M costs + (land * annualization rate)
- annualization factor = i/((1+i)^n - 1) + i
- i = annualization rate, which is always 5%
- n = period of annualization (also called lifespan)
Clicking one of the buttons will download an Excel file with the requested Cost Profile information.
Planning Targets
Planning targets for each state and major basin were established as part of the 2017 Midpoint Assessment of the Chesapeake Bay TMDL. Compare the annual progress scenarios to the planning targets to check progress for each state and state basin. You also can compare the Phase III Watershed Implementation Plans created by states, or other public scenarios.
Results are available only at the state-basin scale because the Chesapeake Bay Program provided targets only at that scale. There is no disaggregation by sector or smaller geographic scales. You can compare a state's Phase III WIP to other scenarios for smaller geographic scales and sectors using the Results-Compare Scenarios function. However, some states exceeded the planning target and others did not meet the planning target.
Clicking on the Export to Excel button downloads an excel file with data shown on the screen. The key to the graphs is dynamic. Clicking on the colored line removes or adds that state basin. Note that the y-axis of each graph is sized for those data and is not comparable among the states' graphs.
More information about planning goals and planning targets is available on the planning goal page.
Scenarios
There are many services available on the Scenarios page. From the My Scenario grid, the user can: create scenarios; view a list of scenarios and scenario statuses; edit scenario metadata and BMPs; and run or delete scenarios.
The Shared Scenario grid allows users to view the public and other user-generated scenarios that have been shared with them. The information listed for shared scenarios include: scenario name, author, status, date modified and any state restrictions which only applies to draft watershed-wide scenarios during development. Only the scenario creator can edit its data, but the users it has been shared with can use it to create their own version of the scenario using the Copy Existing Scenario option.
An important feature for users is the ability to work on multiple scenarios at the same time. For example, users can edit one scenario while running another one or can generate reports or run scenario comparisons using other scenarios while running a new one, or run multiple scenarios at the same time.
My Scenarios Buttons and Icons
| Button/Icon | Description |
|---|---|
| Add Scenario Button | The user can create new scenarios. Copying and/or importing BMPs can simplify the process of creating multiple scenarios for comparison. |
| Edit Icon | The user can edit the scenario metadata, add/or edit BMPs, and view Invalid BMPs for scenarios they create. |
| Run Icon | The user must run the scenario to obtain scenario results. |
| Delete Icon | The user can delete scenarios no longer needed. |
Scenario Name Column
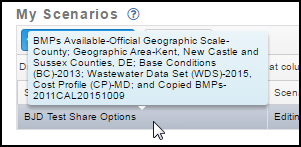
The scenario name tool tip under My Scenarios and Shared Scenarios grids displays the scenario description providing the user with a quick view of important information pertinent to the scenario. The user can use Scenario Description to provide updates as values are changed or as a quick view of the variables used to create a scenario or other pollution reduction actions that are not accounted for in the scenario such as the agencies or departments that collaborated in creating the scenario. The field has a maximum capacity of 5,000 characters which can be used.
Recommendation: Use the description as a quick reference of the selections used to create the scenario which can be seen from the My Scenario Grid. The following example indicates the following selections: BMPs Available-Official; Geographic Scale-County; Geographic Area-Kent, New Castle and Sussex Counties, DE; Base Conditions (BC)-2013; Wastewater Data Set (WDS)-2015, Cost Profile (CP)-MD; and Copied BMPs-2011CAL20151009.
Scenario Status Column
The user can only edit, run or delete the scenarios they have created in the My Scenarios grid. A complete list of possible scenario statuses is in the table below.
| Scenario Status | Description |
|---|---|
| Created | The scenario has been created. The user can edit the scenario metadata or BMPs or the run it to obtain results. |
| Editing | Editing and BMP validation is in progress. |
| Finished Editing | The latest edits have been saved. The user can make further edits to the scenario or run it to obtain results. |
| Running | Calculations are in progress. |
| Run Finished | The scenario can be used to generate one of the ten types of reports listed on the Report page or used to compare up to four scenarios at the same time using the Compare Scenarios page. |
| Deleting | The deleting status will display while a scenario is being removed. |
| Validation Failed | Edit the scenario to view the BMPs on the Invalid BMP tab that won’t be included in the calculation if the scenario is run in the current version. The user can still run the scenario based on the valid BMPs in the current version or can correct the invalid BMPs, save the scenario again which will automatically run validation. |
| System Error | When a system error occurs, an email is sent to both the user and the CAST Team. The user can expect a follow up email from the CAST Team after the error is corrected or if additional information is requested to resolve the issue. |
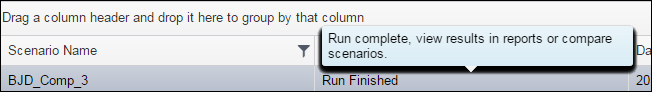
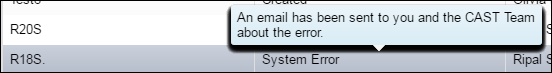
The tool tip for the scenario status column provides valuable information regarding the current or next step to take such as viewing/using the scenario results to generate various reports on the Reports or the Compare Scenarios pages or about the emails generated when a system error occurs.
Scenario Status Example 1 – The only way to see the results of a scenario is to apply it to one of the available report types on the Reports page or to use it in a scenario comparison on the Compare Scenario page.
Scenario Status Example 2 – If a system error occurs, an email will be sent to you and the CAST Team who will contact you directly to resolve the issue.
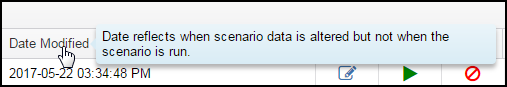
Date Modified Column
The date modified will only change when the scenario metadata or BMPs are altered. Running the scenario will not be reflected in this column.
Run Scenario Icon
Once a scenario is created or edited, background processes take place to prepare it for running. The scenario status will display Editing on the Scenarios Page during this time. Once the prep work is complete, the status will change to Editing Finished and the Run button will be activated which is indicated by the color change to green. Clicking the Run icon will perform the calculations required to create the loads data.
Run Errors
If an error occurs during the run process, the status will display System Error and an email will be sent to the user notifying them of the problem and that the CAST Team will be in contact about the issue.
Delete Scenario Icon
The user can delete a scenario using the Delete icon shown in the My Scenarios grid image shown above. A confirmation message will appear and clicking the OK button will complete the process.
Results
See the Results section of the documentation to learn more about the different ways the scenarios can be used in reports, graphs and scenario comparisons.
See Scenario FAQs for more information.
Add Scenarios
Clicking the Add Scenario button on the Scenario Page opens the Add Scenario page.
All fields used to create a user’s scenario can be revised using the edit process on the Scenario Metadata tab, except the copy/upload BMPs section. When editing the scenario, copy and upload BMPs does not replace previously copied or uploaded BMPs but appends them.
| Fields and Options | All fields used to create a user’s scenario can be revised using the edit process, except the imported BMPs. |
|---|---|
| Mandatory Fields | |
| Scenario Name | Create a scenario name that includes information to make it easily identifiable such as 2011CAL20151009. |
| Scenario Description | Create a description to make it easy to identify selected options, other pollution reduction actions not accounted for in the scenario, or agencies/departments that collaborated in creating the scenario. As you update or make changes to the scenario in the future, you can maintain that information as well. This information will be displayed in the tool tip pop up associated with scenario name on the Scenarios page. The field can contain up to 5,000 characters. |
| BMPs Available | Options include the type of BMPs to use for the scenario. Official BMPs includes only those BMPs that have been approved by the Chesapeake Bay Program. Planning BMPs includes BMPs that are not accepted for reporting Bay TMDL progress. |
| Geographic Scale | Select a geographic scale to use in the scenario. Options range from land-river segment to the Chesapeake Bay Watershed. Once the scenario is created, users may input BMPs at a scale larger or smaller than the one at which the scenario was created and the BMPs will be adjusted to fit the selected scale level or portion thereof. |
| Geographic Area | Select specific geographic area(s) associated with the geographic scale selected. |
| Base Year | This selects the base year for land use, animal, and septic source data. Milestones are set on the land use at the end of the milestone period. The Phase 3 WIP is on 2025. |
| Base Condition | Use the Current Zoning projection method for Milestones, WIP and post-2013 Progress. |
| Wastewater Data Set | Select the wastewater data set that includes the following data: permitted wastewater; industrial; municipal; large monitored septics; rapid infiltration basin; and combined sewer outfall (CSO) connections planned by the state. Connecting CSOs changes the land use from combined sewer systems (CSS) to regulated developed land. Additional waste water sets may be submitted to the Chesapeake Bay Program if you want other options than those that appear in the dropdown. |
| Cost Profile | Select the cost profile to use for the BMPs included in the scenario. Options include state cost profiles and user-generated profiles. If the selected shared cost profile is changed after the scenario is created, it will not impact your scenario. You will need to create a duplicate scenario and apply the new shared cost profile to determine its impact. |
| Optional Fields | |
| Notes | Add optional notes regarding the scenario being created. As you update or make changes to the scenario in the future, you can maintain that information as well. The field can contain up to 5,000 characters. |
| Sharing Options | Option to share a scenario with individuals and/or groups. The user can select to share the scenario with an existing group, share with a modified existing group or create a new group during both the scenario creation and scenario editing processes. The user can also share the scenario with selected specific users. |
| Copy/Upload BMPs | Option to upload BMPs from a file or copy BMPs from existing scenarios. BMPs from existing scenarios can also be added to the new scenario by: electing to add all BMPs from a single scenario; electing to select sector BMPs by specific scenarios; or, electing to add state-related BMPs based on different scenarios. Uploading file categories include Land, Land Policy, Animal and Manure Treatment. After the scenario is created, the user can add, remove or edit BMPs on the BMP edit pages to meet their needs. |
Copy Existing Scenarios Without BMPs
Clicking the Copy Existing Scenarios Without BMPs button opens a pop up allowing the user to import an existing scenario's metadata into the new scenario. The process is completed by clicking the Copy button which is activated after a scenario has been selected.
The Scenario Name field in the new scenario will display the original scenario's name with a " - COPY" added to it and all of the metadata fields will be imported. The user can manually change any of the copied fields as needed.
Sharing Scenarios
This feature allows users to share data and work together within or between organizations while protecting each user’s data from being overwritten by others. It expands the user’s ability to generate reports and comparing scenarios using other users’ scenarios. It also provides the ability to divide BMP work among users, allowing multiple users to work on BMPs simultaneously by sector or state, for example. By sharing these partial scenarios, a final scenario can then be created combining the separate work.
The sharing options available are selecting Group or Selected Users from the dropdown.
Sharing - Specific User
Clicking Selected Users changes the page display and opens the User List and a Search box to filter the users to select for sharing purposes. Select user names in the left box to populate the right box. No other actions are required.
Sharing - Group
Selecting the Group option changes the page display to offer the user three options: selecting an existing user group as it is currently composed, modifying and applying an existing group or creating a new user group to apply to this scenario.
Clicking the Select Group dropdown will display all the state and shared user-generated group options. Selecting a group finished this step. The Members link next to the Group dropdown box will display the users associated with the selected item.
Sharing - Modify Group
Clicking on the Modify a Group button changes the page display and allows the user to select a Group to alter from the dropdown. Once a group is selected, the right box will populate with the names of the members of the group. The user can click on user names from the User List in the left box to add to the new group and/or click on user names in the right box to remove them. Click the Ok button when finished.
Sharing - Add Group
The user can create a new group while creating a new scenario if needed by clicking the Add New Group button. The user will enter a Group Name and have the options of building a new group from the user list, existing group(s) or a combination of both. This is a convenient way to take an existing group the user belongs to and using it to create their own group as is or with changes.
Enter the new group's name and then select a Group from the dropdown to populate the right box. Repeat the process to add members from multiple existing groups, if desired. Also select users from the User List in the left box to add to the new group and/or click on user names in the right box to remove them. Click the Ok button when finished.
Sharing - Delete Group
Clicking the Delete Group button opens a pop up where the user is asked to select the group to delete and then click the OK button. A confirmation pop up will appear reminding users that deleting a group will remove group member access to the shared scenarios and cost profiles.
Copy/Upload BMPs
Select to create a scenario with or without copied/uploaded BMPs from either existing scenario(s), file(s) or a combination of both. The user can elect to upload any combination of Land, Animal, Manure Treatment, or Land Policy BMPs. BMPs from existing scenarios can also be added to the new scenario by: electing to add all BMPs from a single scenario; electing to select sector data by specific scenarios; or, electing to add state-related BMPs based on specific scenarios.
Upload Option
BMPs may be uploaded from a file. The user can create a file of BMPs or download such a file from the Reports Page by selecting BMP Input Files for an existing scenario. Edits can be made to the downloaded input file in a spreadsheet to meet the user's needs and then uploaded to a new scenario.
Mac users should save files for uploads as "Windows Formatted Text (.txt)", not Tab Delimited Text. When you hit return in Windows the computer puts a code of CRLF (carriage return + line feed) at the end of the line. Apparently, Macs put CR only so in windows text just wraps together. So by saving as Windows Formatted Text it forces a CR+LF at the end.
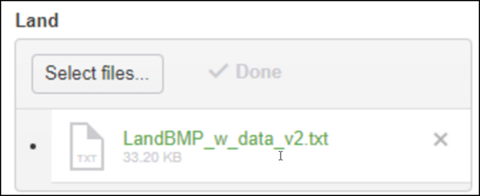
Sample BMP Files
Sample Land, Animal and Manure Treatment files with the required .txt format and field order are provided. A tab delimiter must be used while entering the required data and the default file name can be modified to reflect the user’s preferences. The example below is for the Land BMP sample file. Example file formats are available on the Add Scenario page and examples with sample data are available on the Home Page in the section Methods for Adding BMPs to a Scenario of the Develop a Plan page.
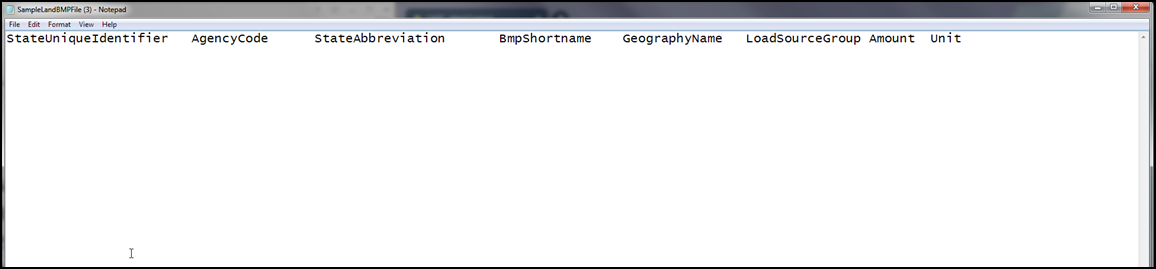
Sample BMP File Fields table – use Tab as the field delimiter.
| Land | Animal | Manure |
|---|---|---|
| StateUniqueIdentifier | StateUniqueIdentifier | StateUniqueIdentifier |
| AgencyCode | AgencyCode | AgencyCode |
| StateAbbreviation | StateAbbreviation | StateAbbreviation |
| BmpShortname | BmpShortname | BmpShortname |
| GeographyName | GeographyName | FIPSFrom |
| LoadSourceGroup | AnimalGroup | FIPSTo |
| Amount | LoadSourceGroup | AnimalGroup |
| Unit | Amount | LoadSourceGroup |
| Unit | Amount | |
| NReductionFraction | Unit | |
| PReductionFraction |
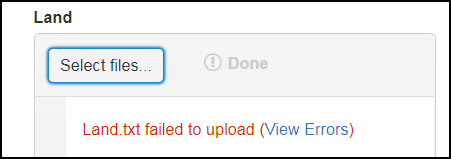
Upon upload, the data is verified to match the required formatting and error messages and confirmation of success or failure are provided. This verification step verifies that the file format and length of the characters is correct. Click on the error item to see if the problem is with the file format, character length or some other issue.
Example of upload failure shown below.
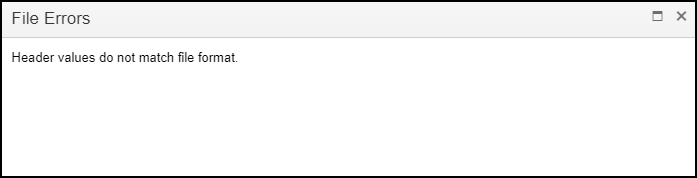
Example of upload error message show below.
Example of upload success shown below.
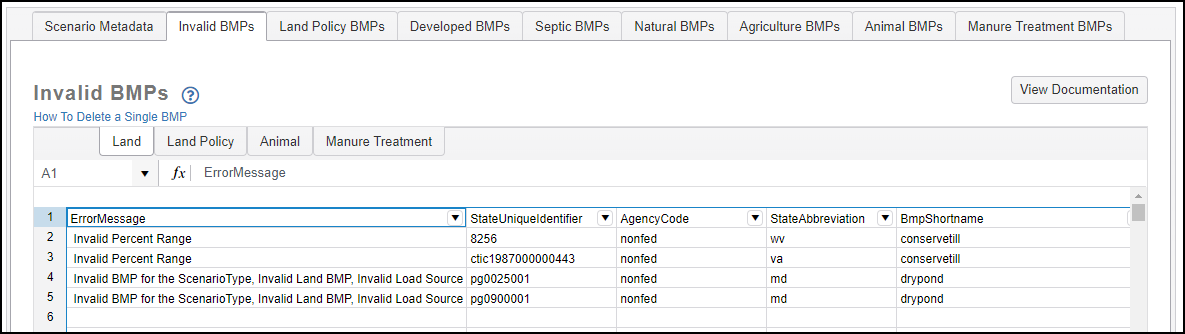
There is another validation step once the scenario is created that checks that the BMP names, unit, geographies and other information is correct. The BMP validation errors will show in the invalid BMPs tab when you select Edit Scenario from the Scenarios page.
Example of Land BMP validation errors listed in the Invalid BMPs tab shown below.
Existing Scenario Option
Select the Existing Scenario tab. The page display changes depending on whether the user elects to copy all BMPs from a single existing scenario or different scenarios per each sector or state.
The single option allows users to copy all BMPs from a selected scenario. This is the most commonly used option.
The sector option allows users to select different scenarios for Agriculture, Developed, Animal, Natural, Septic and Land Policy BMPs. This promotes collaboration among planners who work in different sectors.
The state option allows the user to select a scenario for each state referenced. All data related to the state you selected is copied. That includes the manure transport BMP, which is a BMP that can affect multiple states. Manure can be transported into or out of a state. When copying a scenario for a state, any manure transport records transporting into or out of the target state are included. This copying from existing scenario by state functionality is most useful to staff at the Chesapeake Bay Program office who are creating watershed-wide scenarios from state-created scenarios that were shared with them.
See Add Scenario FAQs for more information.
Edit Scenarios
Edit Scenario Page
The Edit Scenario page is divided into multiple tabs: Edit Scenario Metadata, Invalid BMPs, Land Policy BMPs, Developed BMPs, Septic BMPs, Natural BMPs, Agriculture BMPs, Animal BMPs and Manure Treatment BMPs. The page always opens on the Edit Scenario Metadata tab shown below. The Land Policy tab can only be edited for scenarios where BMPs Available = Planning BMPs and Base Year = 2025.
The Edit Scenario Metadata tab displays all of the options found under Add Scenario.
Add BMP Records
A detailed description of each BMP tab is provided in later sections. To add a BMP record click on one of the BMP tabs: Land Policy, Developed, Septic, Natural, Agriculture, Animal or Manure Treatment.
Add BMP Button
Above the BMP Submitted grid, click on the Add BMP button to open the pop up to enter the BMP details.
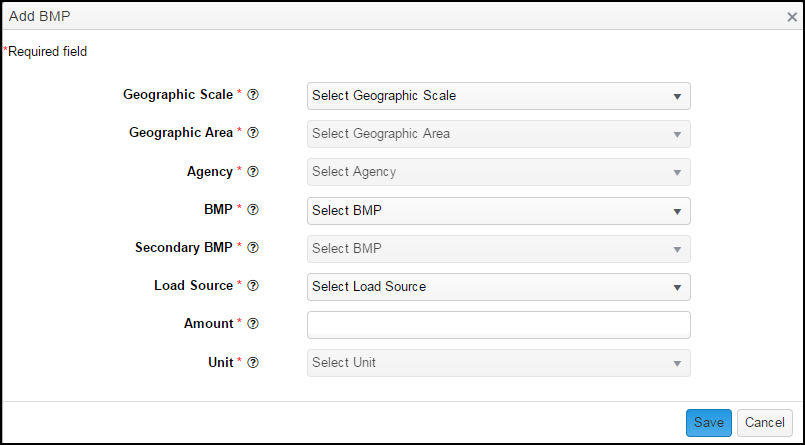
Add BMP Pop Up
The Add BMP pop up selections differ by tab. Certain selections must be made before other dropdowns are populated such as Geographic Scale before Geographic Area and BMP before Secondary BMP. It is encouraged to select Load Source first if targeting a particularly high loading load source. This will restrict the BMPs to only those eligible for that load source. Likewise, selecting BMP restricts the load source to only those load sources available to that BMP. The Agency list will show only the agencies in the geographic area selected. The example below is for the Developed and Natural BMP tabs.
The Add BMP pop up is the same for the Septic and Agriculture BMP tabs. There is no Agency selection since all agriculture and septic load sources are assigned to the non-federal agency classification.
The Animal Add BMP pop up selections are based on particular animal types, like broilers, or groups of animal types, like poultry. The Manure Treatment Add BMP pop up includes selection fields such as Animal Group, County From and County To which are unique to this type of BMP.
The Add BMP pop up selection fields will expand when additional information must be supplied for certain BMPs.
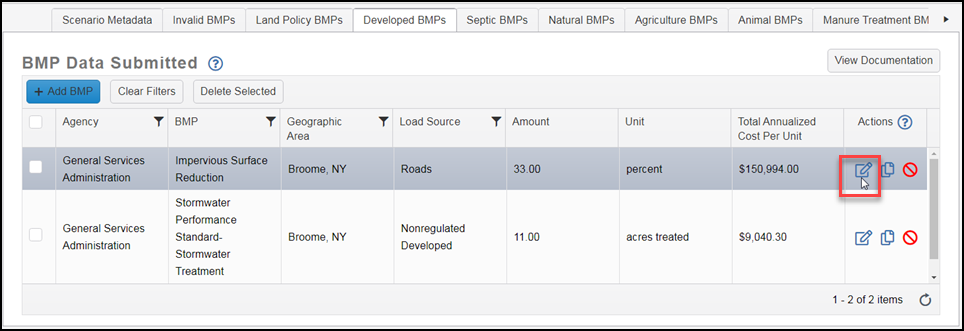
Edit BMP Records
On any of the BMP tabs, click the Edit link next to the BMP in the BMP Data Submitted grid to open a specific Edit BMP pop up.
Edit BMP Pop Up
The Edit BMP pop up will vary depending on the selected BMP. After editing, click the Save button to update the scenario BMP data. Using the Save button on the Edit Scenario tab saves the change, so there is no need to save the entire scenario again.
Delete BMPs
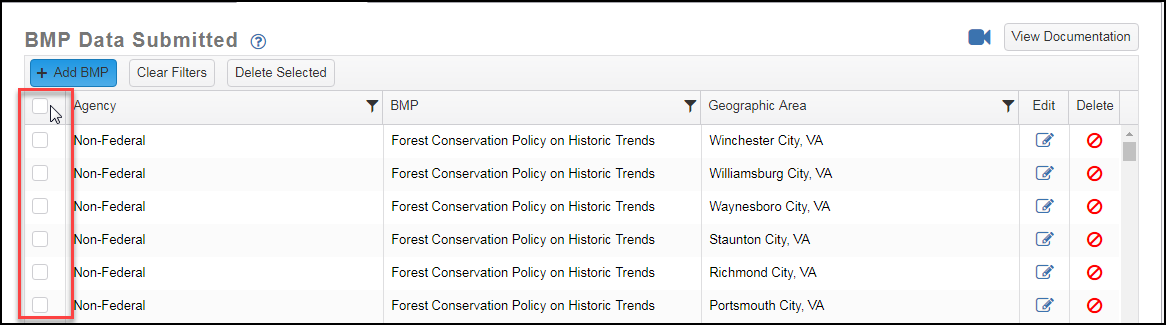
The user can delete BMPs individually using the Delete icon next to each BMP on the BMP Data Submitted grid or by selecting multiple BMPs and the clicking the Delete Selected button on the top of the grid.
An example of an individual delete is provided below. Clicking the Delete icon next to a specific BMP will open a confirmation pop up and selecting the OK button will complete the delete process.
In order to delete multiple BMPs simultaneously, either click the checkboxes for specific BMPs in the grid or click the checkbox in the header row that will select up to the first 500 BMPs, if available, in the grid. To complete the bulk delete process, click the Delete Selected button. A confirmation message will appear with information on the number of BMPs being deleted in this process.
Invalid BMPs Tab
The tab displays a list of invalid BMPs generated during the validation process in the scenario creation process. The BMP data is organized in four tabs: Land, Land Policy, Animal and Manure Treatment. The user has several options for addressing invalid BMPs. The first option is to ignore the invalid BMPs, which will allow the scenario to run without using these BMPs for calculations. The next option is to edit the BMPs on the page to make corrections and then use the Save Changes button to update the scenario. This will work best when only a few invalid BMPs are found. The final option is to use the Download Data button to generate an Excel file to make your changes on your computer, and then import your corrected BMPs using the Upload BMP option on the Edit Scenario page. To prevent a duplication of BMPs (invalid and valid) be sure to use the Delete All Invalid BMP button on this tab after the initial download.
Save Changes Option
The user can edit the BMPs on the page to make corrections and then use the Save Changes button to update the scenario. Save Changes saves the changes on all four tabs, not just the one that is open. Editing on the screen is most useful when only a few invalid BMPs are found.
Download Data Option
Use the Download Data button to generate an Excel file to make your changes on your computer and import your corrected BMPs using the Upload BMP option on the Edit Scenario page. To prevent a duplication of BMPS (invalid and valid) be sure to use the Delete All Invalid BMP button on this tab after the initial download. The confirmation message reminding the user to delete the BMPs after the download process is shown below.
The columns on each tab are outlined below.
| Land | Land Policy | Animal | Manure Treatment |
|---|---|---|---|
| Error Message | Error Message | Error Message | Error Message |
| State Unique Identifier | Agency Code | State Unique Identifier | State Unique Identifier |
| Agency Code | BMP Short Name | Agency Code | Agency Code |
| State Abbreviation | Geography Name | State Abbreviation | State Abbreviation |
| BMP Short Name | BMP Short Name | BMP Short Name | |
| Geography Name | Geography Name | FIPS From | |
| Load Source | Animal Group | FIPS To | |
| Amount | Load Source | Animal Group | |
| Unit | Amount | Load Source Group | |
| Unit | Amount | ||
| Nitrogen Reduction Fraction | Unit | ||
| Phosphorus Reduction Fraction |
See Invalid BMP FAQs for more information.
Pre-BMP Grids
All BMP tabs (except Invalid and Land Policy) contain a Pre-BMP grid which contains a breakdown of load sources without any changes to amounts from BMPs. That is, any BMP that changed the acres of a load source to another are not considered in the Pre-BMP grid data. Post-BMP data is available under Results.
Download Pre-BMP Data
The user can download the data in the Pre-BMP grid at the top of each BMP tab using the Download button.
Land Policy BMPs
There are multiple Land Policy BMPs available. These BMPs change the acres of land use to meet certain planning goals. Land Policy BMPs are available only when BMP type is "planning" and Base Year is "2025". Land Policy BMPs are eligible for either historic trends or current zoning.
Forest Conservation: Organizations and governments proactively pursuing a variety of actions to conserve forests and wetlands which provide the greatest benefits to wildlife, human safety, and water quality. Example priority areas include riparian zones, shorelines, large contiguous forest tracts, and other high-priority forest conservation areas.
- Conserve riparian zones (default width = 30m)
- Conserve wetlands (NWI, State Designated Wetlands, and Potential Conservable Wetlands (PA only))
- Conserve all lands subject to inundation due to sea level rise (default = 1m rise by the year 2100)
- Conserve all lands surrounding National Wildlife Refuges (default = 1 mile buffer)
- Conserve all large forest tracts (default >= 250 acres)
- Conserve Bay shorelines (default = 305m buffer (~1000-ft) of the tidal Bay and Atlantic shorelines)
- Conserve all high-value forest and forested wetlands identified by the Chesapeake Conservation Partnership
Growth Management: Organizations and governments proactively pursuing a variety of actions to encourage growth in areas with supporting infrastructure. Example priority areas include undeveloped or under-developed areas with adequate existing roads, wastewater, and water supply infrastructure.
- Increase proportion of growth occurring as infill/redevelopment (default = 10% per decade)
- Increase urban densities (default = 10% per decade)
- Increase proportion of urban vs rural growth (default = 10% per decade)
- Expand sewer service areas (default = ~1 mile))
- Avoid growth on all soils unsuitable for septic systems (based on depth to bedrock, drainage class, saturated hydraulic conductivity, and flood frequency)
Agriculture and Soil Conservation: Organizations and governments proactively pursuing a variety of actions to conserve farmland and productive soils. Example priority areas include agricultural districts, prime farmland, farmland of state importance, floodplains, and other high-priority farmland conservation areas.
- Conserve all farmland within designated Agricultural Districts
- Conserve all lands within the floodplain (default = 100-year recurrence interval)
- Conserve all lands with flooded soils (default = frequently flooded)
- Conserve all prime farmlands and farmland of state importance
- Conserve potential restorable wetlands (applies only to PA farmland)
- Conserve all high-value farmland identified by the Chesapeake Conservation Partnership
State Land Policy BMPs are available for most states in the Chesapeake Bay Watershed. Implementing the BMP for one state does not change land use in another state. That is, selecting District of Columbia will effect no change in Maryland or Virginia. These state land policy BMPs were developed starting in the summer of 2017 with the joint Land Use Workgroup and Local Government Advisory meeting on future land use scenarios. States were provided with the option of developing their own unique prescription for land use planning and land conservation actions that would be implemented and effective by 2025. The specified actions may represent the collective activities of multiple agencies including private and non-governmental organizations. The actions specified by each jurisdiction for their 2025 Phase III WIP Land Policy BMP are outlined below.
District of Columbia: Restrict new development to areas where local forecasts indicate storm water management regulations will be triggered by future development and/or redevelopment activities.
Delaware:
- Conserve riparian zones excluding tax ditches (width = 30m)
- Conserve wetlands (NWI and State Designated Wetlands)
- Conserve all lands subject to inundation due to sea level rise (1m rise by the year 2100)
- Conserve all lands surrounding National Wildlife Refuges (0.5-mile buffer)
- Conserve all large forest tracts (>= 20 acres) in Legacy areas
- Conserve all Commercial Forest Plantation Areas
- Conserve all high-value forest and forested wetlands identified by the Chesapeake Conservation Partnership
- Increase proportion of growth occurring as infill/redevelopment (10% per decade)
- Increase urban densities (10% per decade)
- Increase proportion of urban vs rural growth (10% per decade)
- Expand sewer service areas in proportion to County-level demand for greenfield residential growth (i.e., 4-14%)
- Conserve all farmland within designated Agricultural Districts
- Conserve all lands within the floodplain (100-year recurrence interval)
- Conserve all lands with flooded soils (frequently flooded)
- Conserve all prime farmlands and farmland of state importance
- Conserve all center-pivot irrigated farmland parcels
- Conserve all high-value farmland identified by the Chesapeake Conservation Partnership
Maryland: Disclaimer: Local governments should consult with their state Watershed Implementation Plan (WIP) planning team before evaluating the effects of Land Policy BMPs in CAST.
Maryland Actions
- Reflect local and state regulations regarding maximum residential densities
- Update protected lands and include Resource Conservation Areas and Wetlands of Special State Concern thereby excluding them from growth
- Conserve forests within 200 ft riparian buffer zones
- Protect the shoreline (100-ft buffer)
- Stochastically simulate conservation within 100 ft riparian farmland buffers based on CREP acres per county using a simple random allocation
- Stochastically simulate conservation of 15% forest within CBLCM modeled "urban" septic areas, weighted allocation based on residential and commercial development probabilities.
- Conserve all P6 model wetlands
- Stochastically simulate rate of forest conservation by County based on participation in state programs and land trust activities using a simple random allocation
- Stochastically simulate rate of farmland conservation by County based on participation in state programs and land trust activities using a simple random allocation
Maryland Policy
- Reflect local and state regulations regarding maximum residential densities
- Update protected lands and include Resource Conservation Areas and Wetlands of Special State Concern thereby excluding them from growth
- Conserve forests within 200 ft riparian buffer zones
- Protect the shoreline (200-ft buffer)
- Stochastically simulate conservation within 100 ft riparian farmland buffers based on CREP acres per county using a simple random allocation
- Stochastically simulate conservation of 50% forest within CBLCM modeled "urban" septic areas, weighted allocation based on residential and commercial development probabilities.
- Conserve all P6 model wetlands
- Stochastically simulate rate of forest conservation by County based on participation in state programs and land trust activities using a simple random allocation
- Stochastically simulate rate of farmland conservation by County based on participation in state programs and land trust activities using a simple random allocation
- Update sewer service area map based on planned expansions
- Conserve areas subject to a 1-m rise in sea levels by 2100
- Conserve all lands within the 100-year floodplain
- Conserve all forests outside Priority Funding Areas in Tier 2 watersheds
- Conserve all Priority Preservation Areas
Pennsylvania:
- Conserve wetlands (National Wetlands Inventory)
- Stochastically simulate rate of forest conservation by County based on participation in state programs and land trust activities.
- Stochastically simulate rate of farmland conservation by County on participation in state programs and land trust activities.
Virginia:
- Conserve riparian zones (100-ft; 30m)
- Conserve shorelines (100-ft; 30m)
- Conserve wetlands (National Wetlands Inventory)
- Conserve all large forest tracts (>=100 acres with high conservation value)
- Increase proportion of growth in urban areas and sewer service areas by 10%
- Simulate a 10% increase in Census Urban Areas and Clusters and Sewer Service Areas
- Simulate a 10% increase in the amount of infill and redevelopment
- Simulate a 10% increase in the density of the Census Urban Areas and Clusters
- Conserve all designated Agricultural and Forestal Districts as defined by § 58.1-3230
- Conserve 100-year floodplain
- Conserve prime farmlands and farmland of state importance (100 acres or more)
West Virginia:
- Stochastically simulate rate of forest conservation by County based on public and private efforts (with updated County rates). Preferentially allocate conservation using Chesapeake Conservation Atlas forest priorities.
- Stochastically simulate rate of farmland conservation by County based on public and private efforts (with updated County rates). Preferentially allocate conservation using Chesapeake Conservation Atlas farmland priorities.
See Land Policy BMP FAQs for more information.
Developed BMPs
The Developed BMP tab shows the pre-BMP load sources in the top grid. The load sources are divided into non-federal and federal agency acres. State-owned lands are included in the non-federal category. These may be expanded to see the individual load sources by clicking on the arrow. The user can add, edit or delete BMPs in the BMP Data Submitted grid. As with all BMP tabs, users may enter BMPs in any order desired because CAST will calculate them in the set order required.
It is not possible to add a BMP if it is already added in units of percent. The existing BMP data can be modified or deleted and then replaced with the new information. Refer to the Edit BMP Pop Up section above for more specifics on editing BMP entries.
See Developed BMPs FAQs for more information.
Septic BMPs
The septic BMP tab contains a pre-BMP septic system grid. The amounts do not include the changes from septic hookups. Septics are measured in number of systems and include large monitored systems.
The user can add, edit or delete BMPs in the BMP Data Submitted grid. The user enters septic BMPs as the number or percent of systems. As with all BMP tabs, users may enter BMPs in any order desired because CAST will calculate them in a set order required. Septic connections are calculated first to reduce the number of systems. CAST next calculates the edge of septic field load prior to denitrification and pumping.
See Septic BMPs FAQs for more information.
Natural BMPs
The Natural BMP tab shows the pre-BMP load source in the top grid. The load source is divided into non-federal and federal agency acres. Clicking on the arrow expands the selection to show the individual load sources. The user can add, edit or delete BMPs in the BMP Data Submitted grid. Note that some natural load sources are measured in units of miles.
It is not possible to add a BMP if it is already added in units of percent. The existing BMP data can be modified or deleted and then replaced with the new information. Refer to the Edit BMP Pop Up section above for more specifics on editing BMP entries.
See Natural BMPs FAQs for more information.
Agriculture BMPs
The Agriculture BMP tab shows the pre-BMP load source in the top grid. The load source is divided into non-federal and federal agency acres. Clicking on the arrow expands the selection to show the individual load sources. The user can add, edit or delete BMPs in the BMP Data Submitted grid.
It is not possible to add a BMP if it is already added in units of percent. The existing BMP data can be modified or deleted and then replaced with the new information. Refer to the Edit BMP Pop Up section above for more specifics on editing BMP entries.
There are no runoff controls in the agricultural sector on land such as cement storage slabs, farmhouses, or driveways. The developed sector's Impervious Buildings and Other load source includes all such impervious surfaces including all barns, agricultural structures, cement storage slabs, etc. These may not be separated from the Impervious Buildings and Other load source because there are a lot of non-agricultural clusters of structures in rural areas. Barnyard runoff control is intended to apply to barns and poultry houses and represents controls such as gutters. Irrigation Water Capture Reuse represents treatment of runoff from container nursery operations.
See Agriculture BMPs FAQs for more information.
Animal BMPs
Animal BMPs are BMPs that are applied to a number of animals, as opposed to acres, for example. These BMPs affect the concentration of nutrients in animal manure or the amount of manure on the feeding space load sources. Manure that is not lost due to storage loss or volatilization while on the feeding operation load sources is applied to cropland. BMPs applied to animals are applied to the entire county, and results are returned for the area within the parcel defined for your scenario.
The pre-BMP grid displays the number of animals and animal units in non-regulated or regulated feeding space. The animal types are all of the animals recognized by the Chesapeake Bay Program and were originally taken from the categories in the Census conducted every five years by the National Agricultural Statistics Service (NASS) in years ending in two and seven. The link below the table allows the data to be downloaded. The data are at the county scale, which is the finest scale available from NASS.
Two other BMPs involve animals, but are applied to load source acres as opposed to the number of animals. These two BMPs, Barnyard Runoff Control and Loafing Lot Management are found on the Agricultural BMP page.
The user can add, edit or delete BMPs in the BMP Data Submitted grid. It is not possible to add a BMP if it is already added in units of percent. The existing BMP data can be modified or deleted and then replaced with the new information. Refer to the Edit BMP Pop Up section above for more specifics on editing BMP entries.
Animal BMPs may be applied to individual animal types or groups of animals. There is a tool tip for each animal type or group describing what is included. Note that livestock includes all animal types except for poultry.
See Animal BMPs FAQs for more information.
Manure Treatment BMPs
The Manure Treatment tab is similar to the Animal BMP tab because it is organized by animal types. Instead of showing the number of animals on feeding space, it shows the tons of manure that are dry. The source data for animals is at the county scale. There are two types of Manure Treatment BMPs: Manure Transport and Manure Treatment Technologies. Broiler mortality freezers BMP is also available as a planning BMP in the Manure Treatment tab when BMP type is "Planning" and Base Year is "2025" in your scenario metadata.
Manure Transport refers to the transport of excess manure in or out of a county. Any movement within the same county should not be included. Enter the quantity in either the dry or wet tons. CAST calculations are performed on dry tons so, if you enter wet tons, the application will make the necessary conversions. Manure Treatment Technologies refers to the conversion of manure organic matter in the absence of oxygen to produce char with a residence time of hours to days. The units must be reported in dry tons and the source location of the manure.
Wet-Dry Manure Conversion Table
The following table provides the fractions to wet manure values by to generate the equivalent dry manure measure. Simply multiply the Wet Tons by the Dry Fraction to get the Dry Tons.
| Animal Name | Manure Dry Fraction |
|---|---|
| Pullets | 0.2594 |
| Turkeys | 0.7353 |
| Hogs and Pigs for Breeding | 0.0168 |
| Beef | 0.12 |
| Broilers | 0.7135 |
| Dairy | 0.14 |
| Hogs for Slaughter | 0.03552632 |
| Horses | 0.15 |
| Layers | 0.2579 |
| Other Cattle | 0.13 |
| Sheep and Lambs | 0.28 |
| Goats | 0.33 |
The user can add, edit or delete BMPs in the BMP Data Submitted grid. It is not possible to add a BMP if it is already added in units of percent. The existing BMP data can be modified or deleted and then replaced with the new information. Refer to the Edit BMP Pop Up section above for more specifics on editing BMP entries.
The animal categories are described on the tool tip from the dropdown. Note that livestock includes all animal types except for poultry. The user must select the source and destination counties when defining a BMP. The tons of manure are taken from the total in the county--the location of animals within a county is not known. Within your scenario, the manure loading rate is applied to manure-receiving load sources based on the acres of manure-receiving land that are defined for the county covered in your scenario’s geographic area. If out of watershed is selected, then the manure is removed as a source of pollutants to the Chesapeake Bay.
See Manure Treatment FAQs for more information.
Results
The Results dropdown in the top menu bar allows the user to access the Compare Scenarios, Reports, Graphs, and Maps pages where users can generate different types of scenario products.
Compare Scenarios
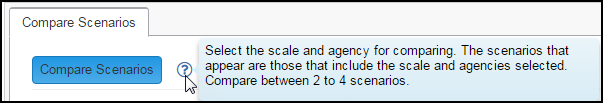
CAST is designed to provide users with the ability to evaluate whether a particular set of BMPs can reduce loads to an allowable amount and be cost effective. In order to assess this, a user needs to compare and contrast the impact of BMPs among multiple scenarios. The Compare Scenario page allows users to compare up to four scenarios using the same geographic area at one time. This facilitates the user selecting the optimal plan for moving forward with implementation.
The user may select the Geographical Scale/Area and Agency to perform the comparison on up to 4 scenarios at one time. The scenario options are restricted to those that match the selected Geographic Scale/Area items and will not populate until Geographical Scale and Area are selected. Scenarios that have not been run or have been edited and require re-running will not show up as available options.
Selecting a Geographic Scale of state level or smaller will expand the display allowing users to select a state to reduce the items displayed in the Geographic Area section.
Compare Scenarios Results
Once the comparison is run, the Costs and Load Source Acres, Loads, Loading Rate and Percent Change tabs will appear.
Annualized Costs and Load Source Acres
This tab consists of two grids: Costs and Load Source Acres. Annualized Costs grid is organized by sectors (Agriculture, Developed, Natural and Septic) with details provided for each scenario. The Load Source Acres grid is organized by the same sectors with additional details available including Load Source and Units. Both grids can be downloaded using their respective Download buttons. If the load source is not measured in acres, then it will be displayed as blank. This is true for natural load sources such as stream bed and bank and shoreline, which are measured in miles.
Loads
This tab consists of three grids: nitrogen, phosphorus and sediment loads. Each grid is organized by sectors (Agriculture, Developed, Natural, Septic and Wastewater) with details provided for each scenario. Each grid can be downloaded using their respective Download buttons.
Loading Rate
This tab consists of three grids: nitrogen, phosphorus and sediment loading rates. Each grid is organized by sectors (Agriculture, Developed, and Natural) with details provided for each scenario. Each grid can be downloaded using their respective Download buttons. The loading rate is the pounds per acre per year for load sources that are measured in acres.
Percent Change
This tab consists of the grid Percent Change in Loads, which is organized by sectors (Agriculture, Developed, Natural, Septic and Wastewater) with details on the percent changes in nitrogen, phosphorus and sediment. The grid can be downloaded using the Download the Percent Change in Loads button. Percent change is calculated as: ((scenario 1-scenario 2)/scenario 1) * -1 * 100. In this way, load increases are positive and load decreases are negative.
When more than two scenarios are selected this page will contain a separate grid for each possible comparison based on the number of selected scenarios.
See Compare Scenarios FAQs for more information.
Reports
The Reports Page contains two tabs, the Create Report tab where users select the type of report and parameters needed to generate a report and the Download Reports tab where the finished reports can be accessed. An email will be sent to the user when the report is available.
Create Reports Tab
The user can select from ten different types of reports, which are listed in the table below, along with the specific parameters required to generate the data. Some reports allow users to select multiple scenarios or aggregations in the same report.
| Report Name | Geo Scale | Geo Area | Scenario(s) | Aggregation | Wastewater Data Set | Atmospheric Data Set |
|---|---|---|---|---|---|---|
| BMP Summary | X | X | X | |||
| BMP Submitted vs. Credited | X | X | X | |||
| Base Conditions | X | X | X | |||
| Loads | X | X | X | X | ||
| Loads Per Unit | X | X | X | X | ||
| Wastewater | X | X | X | |||
| Atmospheric Deposition | X | X | X | |||
| Quick Results | X | |||||
| BMP Input Files | X | |||||
| Nutrients Applied | X | X | X |
The Create Reports tab opens as a generic report display. Once a report type is selected the view will change to display the appropriate report parameter list. After the Geographic Scale is selected, a pre-populated Geographic Area dropdown will appear to make further selections.
Check boxes also allow the users to restrict the scenario list to only items from the user's Scenario list, Shared Scenarios, Public Scenarios or any combination of the three. As listed in the table above, many reports allow the selection of multiple scenarios and/or aggregations in the same report.
Clicking the Submit Report button will generate a confirmation message pop up and clicking the OK button will complete the process.
When the report is ready, the user will receive an email with a link to automatically download the report. The link in the email will be active for only 30 days.
The downloaded Excel file will appear in the download bar at the bottom of a browser page which provides easy access without returning to the Download Report tab in CAST.
Download Reports
Up to 20 reports will be maintained on the Download Reports tab for 30 days. The user can download, delete or view metadata on the displayed reports using the associated icons.
An example of the report metadata is provided below. The fields will vary depending on the type of report generated. Scenarios, Wastewater or Atmospheric Deposition data sets, and Aggregation fields will appear as needed.
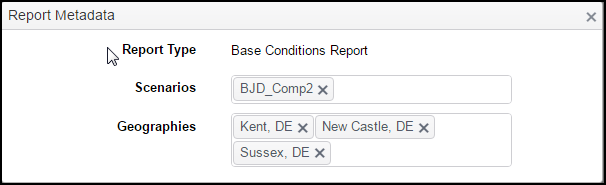
BMP Summary Report
The BMP summary report provides scenario-specific data on BMPs credited. The BMPs are listed along with the amount implemented in the BMP unit, like acres, and in percentages. Individual BMPs and composites are included. Composite BMPs are included for tillage, cover crop, pasture management, waste management, barnyard runoff controls, and stormwater practices. Multiple scenarios can be selected for this report allowing for a comparison of BMP implementation.
BMP Submitted vs. Credited
In addition to the Read Me tab with the field names definitions, there are details about the scenarios in the report, land, animal and manure BMPs. In each of these sheets, the BMPs are listed along with information tied to each BMP. If any of the sheets have no data, it is because there were no BMPs of that type. You may use the information in these files to determine if the amount of BMPs submitted on the BMP pages was fully credited. It is possible that the submitted amount of BMPs was not fully credited because, for example, the amount was greater than 100% of the land use acres available for the BMP.
For BMPs that involve changing area from one land use type to another, the change in load between the two conditions – the original condition and the post-BMP condition. Typically the higher loading land use is converted to the lower loading type. Once new landcover or land use imagery is incorporated with the model that covers the progress year when the land use change was first credited, it is assumed the new land use and land cover data captures the change. Continuing to credit the benefit would double-count the BMP.
A back-out process in the model allows for the BMP acres to remain in place for tracking BMP progress, but the model no longer credits the movement of reported acres from one land use to another. The model credits this movement through the change in land use and land cover captured by the imagery. In CAST reports, the amount backed out is identified for each relevant BMP type, its location, and the land use types involved. The efficiency portion of the BMP continues to be credited even when the land use change portion is backed out. This only applies to certain land use change BMPs, like buffers. The excess field represents the units of a BMP in a specific geography that were not backed out but do not receive credit because there were not enough units in that area for them to receive credit. Additional BMP information may be found on the CAST home page under BMPs - BMP Documentation and Section 6 Best Management Practices of the Model Documentation. The last section of the document (Section 6.6) includes BMP exceptions, which may be useful in explaining unanticipated results.
Base Conditions Report
This report provides information on the base conditions utilized for the selected scenario, including load source acres, septic systems, and animal counts. In addition to the Read Me tab with the field names definitions, there are details about the scenarios in the report, animal counts, load source amounts, and septic systems. The animal count tab includes both the number of animals and the animal units. An animal units is 1,000 pounds of live animal. The number of animals may not be changed in a scenario. The manure may be removed from the scenario by using the manure transport BMP and transporting out of the watershed. The acres includes the pre- and post-BMP acres. Not all load sources have acres, some deliver loads directly to a stream, like riparian pasture deposition and stream bed and bank. Post-BMP acres for the scenario show the changes to the acres in each load source that result for land use change BMPs. More information on BMPs and their effects is on the CAST Home page under BMPs - BMP Documentation. Septic systems are shown as pre- and post-BMP systems. The number of systems can change with the septic connection BMP. That BMP eliminates the load to the septic load source. It is assumed that the wastewater load is increased, but the load is not transferred since wastewater is directly monitored. The monitoring includes the amount that is picked up from connected septic systems.
Loads Report
This report provides scenario-specific data on loads. Multiple scenarios may be in this report, which facilitates comparisons. The loads are provided for the aggregations, geography, and scenarios that you selected. The allocation column refers to whether that load source falls into the 2010 Chesapeake Bay Total Maximum Daily Load's (TMDL) load allocation or wasteload allocation. The edge of stream (EOS) and edge of tide (EOT) loads are provided for total nitrogen (N), total phosphorus (P), and total suspended solids (S). The loads are pounds per year. The unit column is the measurement only for the amount column. Many load sources are measured in units of acres; some are measured in units of miles. Other load sources are delivered directly to a stream so the amount is pounds. Acres are available in the Base Conditions report and may be used to calculate pounds per acre. This only makes sense for the load sources measured in units of acres. Summing all amounts and dividing by all amounts from the base conditions report would be a logic error. Pounds per acre are also provided in the Loads Per Unit Report (see description below).
Loads Per Unit
This report provides scenario-specific data on the pounds per acre for those load sources that are measured in acres. Shoreline, Stream Bed and Bank, and Septic loads are measured in units of miles or systems and those loading rates are also provided. There is no loading rate for CSO, Industrial Wastewater, RIB, or Riparian Pasture Deposition since those are direct loads and do not have an area from which to create a loading rate. The loading rate is provided for the aggregations, geography, and scenarios that you selected. The edge of stream (EOS) and edge of tide (EOT) loads are provided for total nitrogen (N), total phosphorus (P), and total suspended solids (S). The loading rate is pounds per acre per year, or miles or systems per year depending on the load source. The unit column is the measurement only for the amount column. The amount column shows the total acres, miles, or systems available.
Wastewater Report
This report provides scenario-specific data on wastewater, combined sewer overflow (CSO), monitored septic systems, and rapid infiltration basins. The loads are provided for the aggregations, geography, and scenarios that you selected. In addition to the Read Me tab, there are three additional tabs: combined sewer overflow, wastewater treatment plants, and monitored septic and rapid infiltration basins. If there are no data on any tab it is because there are not any facilities of that type in the geographic area and year that you selected. Wastewater loads are reported for calendar year for the District of Columbia and Virginia. All other states use the progress reporting year of July 1 to June 30.
Atmospheric Deposition Report
This report provides scenario-specific data on atmospheric deposition of wet and dry nitrogen and phosphorus to the land. The loads are provided for the aggregations, geography, and scenarios that you selected. The atmospheric deposition data are provided for each nutrient species for each land segment. The units are pounds per acre per year. The amount is the same regardless of load source. The data do not vary by river segments. These data are not changed by BMPs. The atmospheric deposition includes both dry and wet deposition. More information on these data may be found on the CAST Model Documentation page, Section three, found under the About header in the top navigation bar.
Quick Results Report
The Quick Results report provides data on the scenario you selected. It includes five reports in one file. This report is designed to provide single scenario results without having to make multiple selections. In addition to the Read Me tab, there are tabs for Summary Loads, Detailed Loads, Land BMPs, Animal BMPs, Manure Treatment BMPs. The summary loads are summarized for each loads source and agency for the scenario. Detail loads provides the loads for the geographical scale you selected. Land, animal and manure treatment BMP tabs provides the same information that is in the BMPs Submitted vs. Credited Report, but at the geographical scale you selected.
BMP Input Files
The BMP Input Files report option will generate up to 4 text files (Land, Policy, Animal and Manure Treatment) depending on the BMPs included in the selected scenario. Each file will be generated separately. The BMPs in the progress scenarios all use the progress reporting year of July 1 to June 30.
Nutrients Applied Report
The Nutrients Applied report shows the source of each nutrient and the load source to which it is applied. This is the only place in CAST where you can see the source of nutrients. Sources include biosolids, inorganic agricultural and urban fertilizer, manure applied and directly deposited. Users can not change the amount of nutrient sources, but can control their application and runoff by implementing BMPs. The report is only available at the county scale since nutrient sources of animal manure are calculated at that level. The report will show data for whole counties including the portions that may be outside of the Chesapeake Bay watershed.
See Report FAQs for more information.
Understanding Results
See Understanding Results FAQs for more information.
Graphs
The Graphs page opens on the Create Graph tab where the user can select the parameters to generate the graphics including: geographic scale/area, agencies and up to four scenarios. Click the Graph button to create the graphs once the selections are made.
If state or smaller geographical scale is selected, the tab will expand to include a state selector field that restricts the geographic areas selections available.
Loads Graph
The Loads tab displays two bar graphs: combined nitrogen and phosphorus, and sediment. All selected scenarios are displayed in each graph for a side-by-side comparison of each scenario and both edge of stream (EOS) and edge of tide (EOT) values. Hovering over the bars in the graph will display the numerical values for each bar. Clicking on the items in the legend will add or remove bars from the chart. The combined graphs may be downloaded as a single page.
Sources Graphs
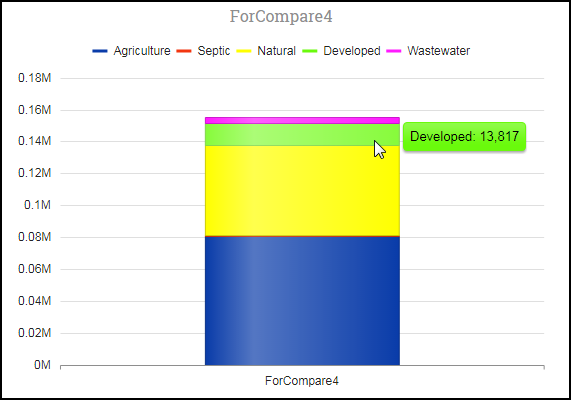
The Sources tab displays individual sector-based bar graphs for each scenario organized in three groups: nitrogen, phosphorus and sediment. The combined graphs may be downloaded as a single page.
Hovering over a section in the bar graph will display the numerical value associated with it.
Maps
Maps based on public scenarios are also available to logged in users under the Results dropdown. For additional information, refer to the Maps information under the Public Reports documentation section.
Cost Profiles
There are many services available on the Cost Profiles page. From the My Cost Profiles grid, the user can: create profiles; edit cost profile metadata and BMPs; view the last date modified; and download or delete items.
The Shared Cost Profiles grid allows users to view the official state and other user-generated profiles that have been shared with them. The information listed for shared profiles include: cost profile name, author, date modified and a download link. Only the profile creator can edit its data. Shared Cost Profiles can be edited by other users by creating a new cost profile and Copy From Existing cost data.
Add Cost Profiles
To add a cost profile, click on the Add New Cost Profile button at the top right of the My Cost Profiles table. Enter a name and description using data that will make it easier to identify the purpose of the profile or when and how it should be used. Use the Copy From Existing option to build a profile from one of your existing profiles or a shared profile. The user has the option to share a cost profile with individuals and/or groups. The user can select to share the profile with an existing group, a modified existing group or a new group during both the profile creation or editing processes. The user can also share the profile with selected specific users.
Copy From Existing Cost Profile
The user can select to create a cost profile from an existing cost profile from an official state profile, one they have created or has been shared with them.
Share Cost Profile
Refer to the sharing options defined under Add Scenario.
Edit Cost Profiles
Selecting the Edit link in the My Cost Profiles grid will open the Edit Cost Profile pop up.
Edit Cost Profile Metadata
All fields used to create a user’s cost profile can be revised using the edit process on the cost profile metadata tab, except for the Copy from Existing field. Any changes to BMPs must be made on the BMP tabs on the Edit Cost Profile page.
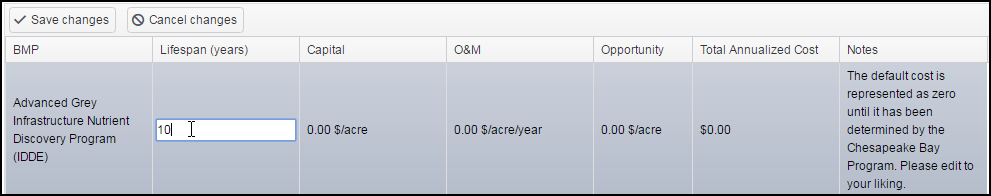
Cost Profile BMPs
As an example, an Agriculture BMPs tab is provided below.
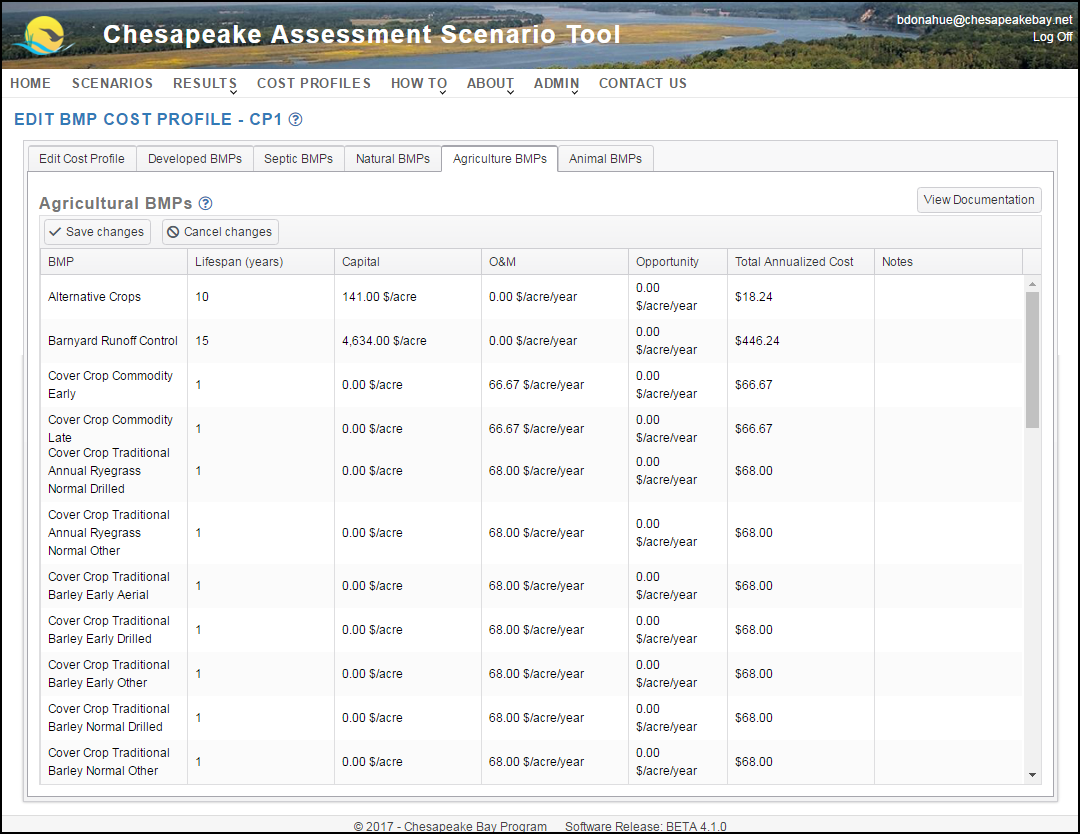
The only field that is not editable is the Total Cost column which is a calculated value. Clicking on a value in any column changes the field to a textbox. Clicking the Save changes button will automatically update the BMPs associated with the entire cost profile. The Developed, Septic, Natural and Agriculture tabs contain the same columns as shown below.
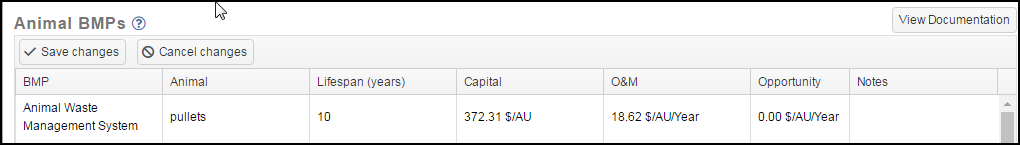
The Animal tab contains the additional Animal column which cannot be edited.
Default unit cost estimates are provided for each state and the Chesapeake Bay Watershed. The Chesapeake Bay Watershed is an average of all states. Costs are provided as a starting point to use for creating your own cost estimates of various BMP scenarios. Costs are estimated in 2018 dollars. Costs are those incurred by both public and private entities. Technical assistance is not included in costs. Costs are for all BMPs in a scenario, both those currently implemented as well as those planned.
There are two cost formulas. For Total Annualized Cost, capital and opportunity costs are amortized over the BMP lifespan and added to annual operations and maintenance (O&M) cost. The interest rate for capital and opportunity costs is 5%. Costs represent a single year of cost rather than the cost over the entire lifespan of the practice. Total Annualized Costs are annualized average costs per unit of BMP (e.g.: $/acre treated/year). These costs are for a single year, and are not accumulated over time. The reason is two-fold. First, once the Bay TMDL deadline of 2025 is met, BMPs will need to remain in place to control loads and new BMPs will need to be implemented to offset new growth. Second, it is difficult to predict when a BMP is going to be implemented. Using this cost formula makes evaluations of costs among scenarios more comparable. The Total Annualized Cost formula is:
- annual costs = (capital * annualization factor) + O&M costs + (land * annualization rate)
- annualization factor = i/((1+i)^n - 1) + i
- i = annualization rate, which is always 5%.
- n = period of annualization (also called lifespan)
For Total Implementation Cost, the entire capital cost and one year of opportunity cost are summed. Total Implementation Cost does not consider life cycle costs. The formula is:
- capital + land
The formula is selected in the Edit Cost Profile section. To edit the components of each BMP's costs, go to the sector table: urban, septic, forest, agricultural, and animal manure. Click on any dollar amount and type in a new number. If there is no dollar amount, you can add one. You may also add free text to the notes field. When done, click on save or cancel changes at the top of the table. The total cost will recalculate.
Download Cost Profiles
The user can download Cost Profiles from the Cost Profile page.
Delete Cost Profiles
The user can only delete the cost profiles they have created. Click the Delete icon next to the cost profile to be removed. A confirmation message will appear before it is deleted. Click the Ok button to complete the process.
See Cost Profiles FAQs for more information.
Learning
The How To dropdown on the menu bar contains links to User Documentation, Free Training Videos and FAQs.
User Documentation
The user documentation is organized into sections based on functionality and is easily accessible using the Table of Content links provided on the left side of the page.
Table of Content Links
The Table of Contents displays the major sections of the documentation by default. The user can click on the Expand All link at the top of the Table of Contents to display all of the section and subsection titles. To only view additional information for a specific section, the user can click on the plus sign (+) next to a section title, if more information is available. Clicking the minus sign (-) next to a section title, will return the view to the original section title only display.
Downloading Documentation
Selecting the Print All link on the User Documentation page will open up a print screen. It may take a minute for the print options to load.
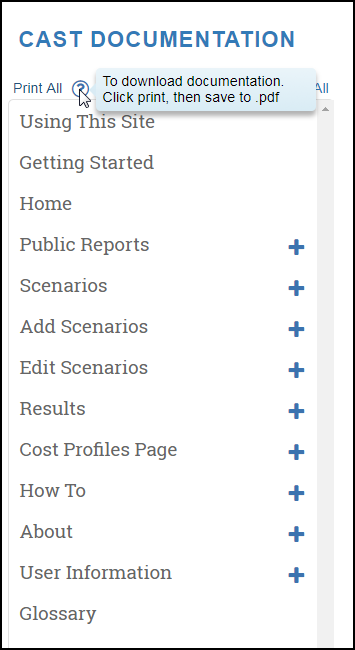
Another option is to download a specific topic in the documentation using the Print Section button above each section which also opens the print options sidebar.
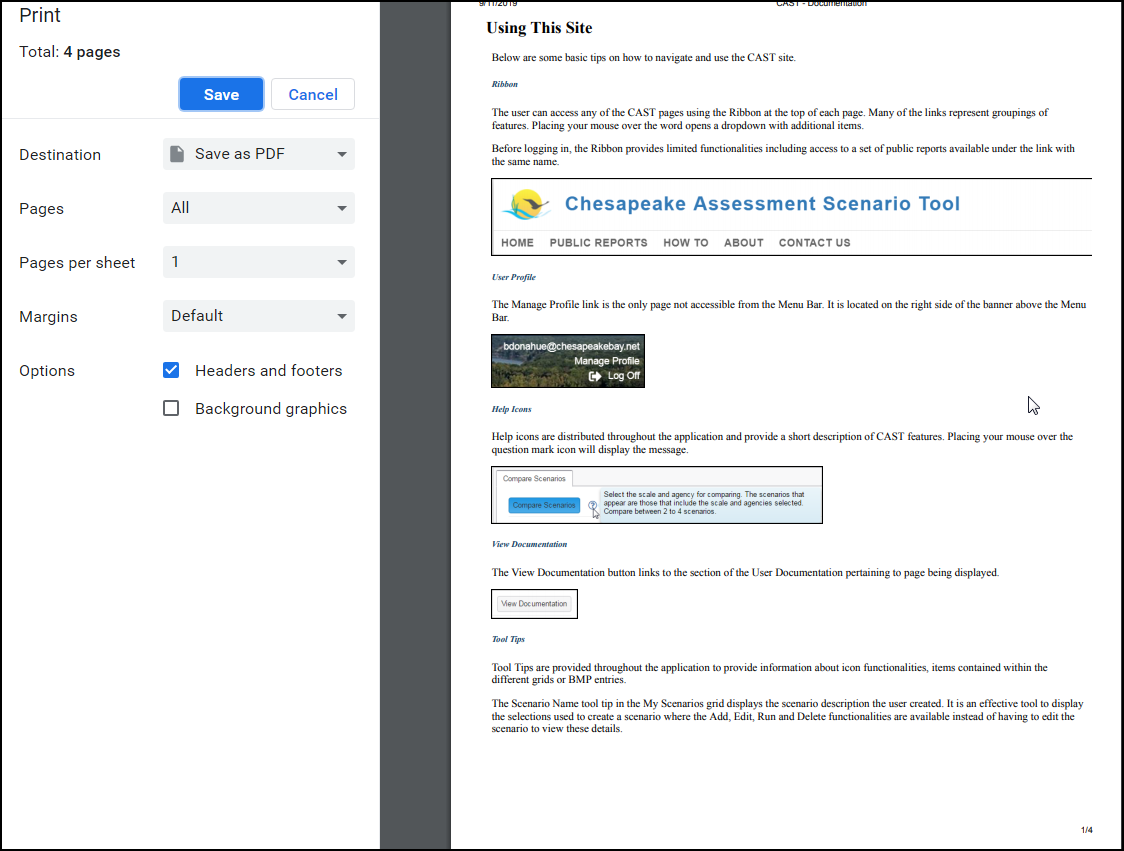
Click the Change button and select saving the document as a pdf. Click the Save button and select the file location to complete the process.
Free Training Videos
All CAST webinar and tutorial videos are available to view through the Free Training Videos page. Videos are consolidated by topic. Expand the list of videos by clicking the plus sign (+) next to a topic title. Return the view to the original topic display by clicking the minus sign (-) next to a topic title. Hover your cursor over the video name to view a brief description of the information covered in the video. The length of the video is listed in minutes to the right of the video name. Information on upcoming webinars and registration links are also provided on this page. All our learning resources remain free and open to all.
FAQs
Informative answers to common questions are consolidated by topic.
About
The About link is available to users whether or not they are logged into the CAST application and provides access to the About CAST version documentation and the dynamic, or time-variable, Watershed Model documentation, and Upgrade History pages.
About CAST Page
The About CAST page provides answers to common questions about CAST such as: what it is, who benefits from using it, why it was developed and how it should be referenced in documentation.
Suggested Citation for CAST References
Chesapeake Bay Program, 2024. Chesapeake Assessment and Scenario Tool (CAST) Version 2023, Phase 6-[7.XX.X see bottom of any page for specific version number]. Chesapeake Bay Program Office, Last accessed [Month, Year].
Model Documentation
The Model Documentation page includes information about the Phase 6 model, its documentation, and links to calibration data, model review seminar and files.
Upgrade History Page
The Upgrade History page contains a list of the updates with a quick summary of the modifications represented in each version. These upgrades reflect changes made to underlying data including BMPs. These updates are not the same as software updates, which would not change data or calculations.
User Information
User Profile Page
The user can access their User Profile page using the Manage Profile link found at the top right of all CAST pages after logging into the application.
The User Profile page contains the data entered when the user registered for a CAST account. The user's name, email address and organization can be edited and the password can also be changed from this page.
Change Password
Clicking the Change your password link on the User Profile page shown above will open the Change Password page. The user will be required to enter the old password and the new password twice and then click the Change Password button. The user will be automatically logged out and returned to the Home Page to log in with the new password.
The new password must be at least 12 characters and contain at least one lowercase, one uppercase, one digit and one special character.
Forgotten Password
The Forgot Password link is located in the log in pop up box under the sign in block. Clicking the link opens the Forgot Password page where the user can enter their email address and click the Forgot Password button to start the process. A confirmation message will appear and the user will be sent an email with a temporary password and a reset password link.
Both links in the email open the Reset Password Page where the user can enter their new password. Clicking the Submit button will generate a confirmation message. Use the Return to Login Page link to enter your new password and access the CAST application.
User Groups
The user can add, edit or delete groups they create on the Add/Edit Scenario pages and the Add/Edit Cost Profile pages. It is important to know that only a group owner can edit or delete one of their groups. Once a group is deleted, the shared scenarios and/or cost profiles will be removed from the member's respective shared list and will no long be accessible to them. Refer to the Sharing Scenarios subsection under Add Scenario for specific information on User Groups.
Contact Us
The Contact Us link is available in the Menu Bar with or without logging into the CAST application. The CAST Team will reply to your inquiry as quickly as possible. Clicking the Contact Us link in the Menu Bar without logging in will open a pop up with two required fields: Subject and Message. Clicking the Send button will complete the process.
See CAST User FAQs for more information.
Registration
Individuals can register for a CAST account by clicking the Register button on the CAST Home page. The Register page is used to capture data for the user profile and the email provided will be utilized as the CAST username for the account. Click the Register button to complete this step. A Registration Confirmation page will be displayed and an email sent to the email address provided.
The Account Activation email will contain the username and two links to return to the CAST Home page. Click one of the links in the email to open the CAST Reset Password page where the user can create a password following the minimum requirements of 12 characters including at least one lowercase, uppercase, digit and special character. Clicking the Submit button opens the Reset Password Confirmation page. Use the Return To Login Page button or the Home link in the menu bar to return to the Home page to login in using the new password.
Glossary
Glossary Content: Detailed source data with definitions for load sources and BMPs is available here.
| Abbreviation | Definition |
|---|---|
| Allocation Air | The atmospheric deposition load predicted with the Clean Air Act regulations in place. Atmospheric deposition includes wet and dry nitrogen and phosphorus. All scenarios in CAST are run with Allocation Air. Some scenarios shared by CBP Admin may include scenarios run with Real Air, or the atmospheric deposition expected in that year. |
| AU | Animal Unit, 1000 pounds of live animal |
| BMP | Best Management Practice |
| CAST Version | The CAST version reflects changes that impact data, calculated loads, BMPs, and changes to the interface. This version uses the Phase 6 Watershed Model calibration. Changes to the data that would require a new version are changes to source data like BMP efficiencies and updates to fertilizer data. Changes are recorded in a semantic format by major.minor.patch releases. The major CAST version is planned to change every couple years to coincide with the Chesapeake Bay milestone years years. Minor version changes include changes to the interface, and patch version changes include things such as bug fixes. Changes to the version are reflected in the Upgrade History. |
| CBP | Chesapeake Bay Program |
| Crop Need | This term is used to apply to the application rate calculation used for crops. Application rate is referenced in terms of the ratio applied, the ratio of an estimate of the amount of nitrogen and phosphorus available to be applied with the amount that should be applied in typical situations. Sometimes, the ratio applied is greater than 100%, indicating that more nitrogen and phosphorus are available than is necessary for plant growth to achieve the crop yield in a typical situation. Other times, the ratio applied is less than 100%, indicating that less nitrogen and phosphorus are available than is necessary to achieve the crop yield. It is calculated as the Actual rate = (TN lbs / crop yield) * (NASS yield / acre). |
| CSS | Combined Sewer Systems |
| E3 | Everything, Everywhere by Everyone Scenario. This is used to bracket the total load that can be reduced. It is intended to represent the limit of technology. |
| EOS | Edge of Stream. This is the load that reaches the edge of a small stream. The load is not comparable to the edge of stream in older versions of the model. There is attenuation that occurs between what is applied to the land as fertilizer, manure, atmospheric deposition and other sources and the load that reaches the stream. The attenuation can be due to multiple factors such as soil properties and pervious or impervious surfaces. |
| EOT | Edge of Tide. This is the load that reaches the edge of the tidal portion of the Bay. There is attenuation that occurs between the nitrogen, phosphorus and sediment that reaches the edge of stream and that which reaches the Bay. This load can be decremented by denitrification and other water chemistry and stream physical processes. The phosphorus and sediment load may be higher at EOT than at EOS where the stream itself is a source of the load. Use the EOT load when working with the Bay TMDL Phase III WIP. The WIP targets are at EOT. |
| EPA | United States Environmental Protection Agency |
| Flow Splits | Usually, the load for a wastewater treatment plant is attributed to the land-river segment the outfall is located in. However, some wastewater treatment plants process waste for more than one county, so the load must be split. In these cases, the load is attributed to the land segment (FIPS with N, H or D added) of the county + the river segment the outfall is in. In some cases, these result in non-physical land-river segments because the county is not in the river segment that the outfall is in. An example of this is the Blue Plains. Outfall 002 has 5 land-river segments assigned to it: 1 in DC, 2 in Maryland, and 2 in Virginia. In order to assign the share of the load appropriately in the model, a fraction of the flow is assigned to each land-river segment. |
| Delivery Factors | Delivery factors represent the fate and transport of nutrients and sediment from the land to the water. The delivery factor is an estimate of the fraction of load reaching a stream, in a given basin, that will eventually make it to tidal waters. In the phase 6 model, it is calculated as a combination of stream and river factors. |
| Land-River Segment | Land segments are counties or portions of counties where there is a distinct difference within the county, like a change in physiographic region. HSPF land uses simulations are run for land segments, which are the breakout of counties into Normal, High, and Low rainfall areas. River segments are the areas that drain to a stream reach. A river segment or a catchment can be made of portions of different land segments and land uses. These are not comparable to HUCs. Using an example of river segment ID SU2_0020_0140, the 3rd character (SU2_0020_0140) indicates the flow size of the river segment. Characters 5-8 (SU2_0020_0140) is the ID for the river segment itself and characters 10-13 (SU2_0020_0140) is the ID for the downstream segment. Land-river segments are intersections of the two and are the smallest area in the model. The average size of land-river segments in the Chesapeake Bay Watershed is 33.4 square miles, which is approximately 21,400 acres. |
| Large Septic Systems | A septic system is considered a large septic system if it receives solely sanitary waste from multiple dwellings or from a non-residential establishment, and if the system has the capacity to serve 20 or more persons per day. Volume and concentration are reported. Residential and commercial systems are differentiated in CAST. For residential systems, the population served is also reported so that this population can be removed from the population for the single-family unit systems in the model. |
| NEIEN | National Environmental Information Exchange Network |
| No Action | Scenario with no BMPs, or no actions taken. Usually the atmospheric deposition and wastewater are from 1985. |
| NRCS | Natural Resources Conservation Service |
| Official BMPs | BMPs that have been approved by the Chesapeake Bay Program Partnership and are accepted in annual progress reports |
| PCB | polychlorinated biphenyl. A persistent organic pollutant. PCBs were banned in 1979, but persist in the environment. |
| Planned BMPs | BMPs that have not been approved by the Chesapeake Bay Program Partnership but are available for planning scenarios, like WIPs and Milestones |
| Progress | A progress scenario includes all the BMPs functioning between July 1 and June 30 of the year in the scenario name. These BMPs may have been installed in prior years and still functioning, like a forest buffer. Some BMPs need to be implemented every year like street sweeping or cover crops. Progress scenarios are sometimes denoted by a V, or version number. The latest version is typically the one you want to use. The plan is that once the progress scenario is finalized, then the V is removed. |
| Software Release Version | The software release version indicates the version of the application. Versions change when enhancements to the CAST web interface changes. The software release is not an indicator of calculation methodology changes or of new BMPs added, or any other change related to data. Data changes are reflected in the Model Version, found on the Add Scenario page or in the Read Me for reports. |
| Spray Irrigation | Spray irrigation is a method of disposing secondary treated wastewater by spraying it on land. Agricultural spray irrigation is applied to agricultural land, and urban spray irrigation is applied to urban land. |
RIB | Rapid Infiltration Basin |
| TMDL | Total Maximum Daily Load |
| USGS | United States Geological Survey |
| WIP | Watershed Implementation Plan. The WIP2 is the Phase 2 Watershed Implementation Plan developed by the states to indicate the BMP implementation planned to be implemented by 2025 to meet the 2010 Chesapeake Bay TMDL. During 2018-2019, the states develop the Phase 3 WIP using this newly updated version of CAST. |
| WRTDS | Weighted Regressions on Time, Discharge and Season (WRTDS). Used to describe long-term monitoring trends in both concentration and discharge. |